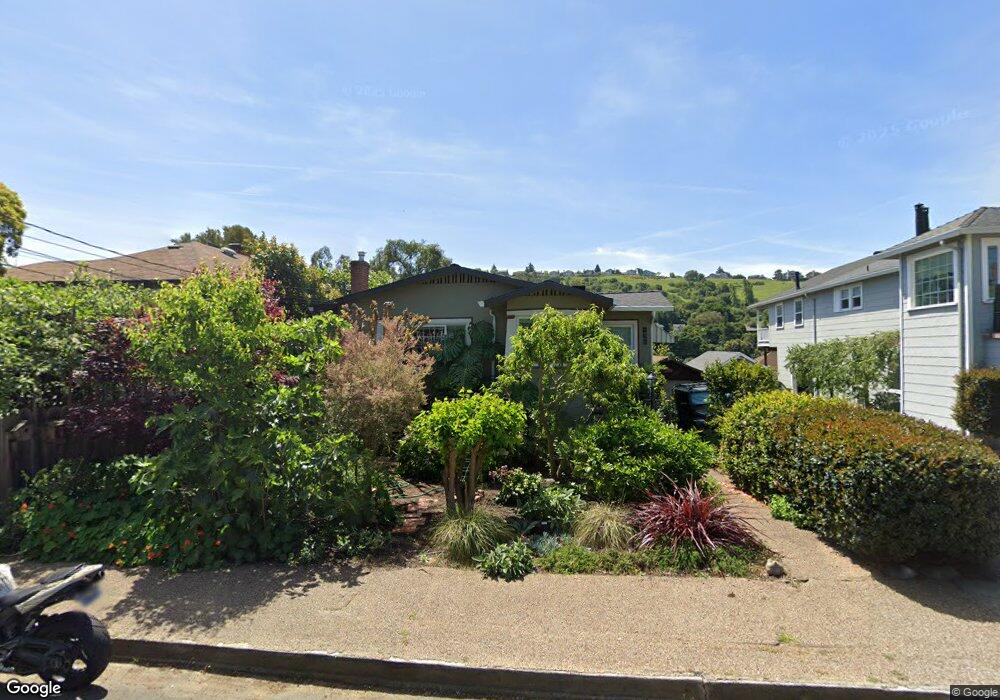
435 Edwards St Crockett, CA 94525
Estimated Value: $670,000 - $778,000
3
Beds
2
Baths
1,575
Sq Ft
$448/Sq Ft
Est. Value
About This Home
This home is located at 435 Edwards St, Crockett, CA 94525 and is currently estimated at $705,596, approximately $447 per square foot. 435 Edwards St is a home located in Contra Costa County with nearby schools including Rodeo Hills Elementary School, Carquinez Middle School, and John Swett High School.
Ownership History
Date
Name
Owned For
Owner Type
Purchase Details
Closed on
Sep 23, 2019
Sold by
Honeycutt Margaret Seter and Honeycutt Erik D
Bought by
Honeycutt Margaret Seter and Honeycutt Erik D
Current Estimated Value
Home Financials for this Owner
Home Financials are based on the most recent Mortgage that was taken out on this home.
Original Mortgage
$410,000
Outstanding Balance
$359,128
Interest Rate
3.6%
Mortgage Type
New Conventional
Estimated Equity
$346,468
Purchase Details
Closed on
Sep 5, 2006
Sold by
Lunsford Renee
Bought by
Honeycutt Erik and Honeycutt Margaret
Home Financials for this Owner
Home Financials are based on the most recent Mortgage that was taken out on this home.
Original Mortgage
$424,000
Interest Rate
6.12%
Mortgage Type
Purchase Money Mortgage
Purchase Details
Closed on
Jun 30, 1999
Sold by
Berta Elsie M
Bought by
Elsie M Berta Living Trust
Create a Home Valuation Report for This Property
The Home Valuation Report is an in-depth analysis detailing your home's value as well as a comparison with similar homes in the area
Home Values in the Area
Average Home Value in this Area
Purchase History
| Date | Buyer | Sale Price | Title Company |
|---|---|---|---|
| Honeycutt Margaret Seter | -- | First American Title Company | |
| Honeycutt Erik | $530,000 | Chicago Title Co | |
| Elsie M Berta Living Trust | -- | -- |
Source: Public Records
Mortgage History
| Date | Status | Borrower | Loan Amount |
|---|---|---|---|
| Open | Honeycutt Margaret Seter | $410,000 | |
| Closed | Honeycutt Erik | $424,000 |
Source: Public Records
Tax History Compared to Growth
Tax History
| Year | Tax Paid | Tax Assessment Tax Assessment Total Assessment is a certain percentage of the fair market value that is determined by local assessors to be the total taxable value of land and additions on the property. | Land | Improvement |
|---|---|---|---|---|
| 2025 | $8,436 | $637,000 | $456,720 | $180,280 |
| 2024 | $8,433 | $637,000 | $456,720 | $180,280 |
| 2023 | $8,433 | $637,000 | $457,000 | $180,000 |
| 2022 | $8,543 | $637,000 | $457,000 | $180,000 |
| 2021 | $7,880 | $590,500 | $423,379 | $167,121 |
| 2019 | $6,814 | $500,000 | $358,492 | $141,508 |
| 2018 | $6,161 | $450,500 | $323,002 | $127,498 |
| 2017 | $5,915 | $431,000 | $309,021 | $121,979 |
| 2016 | $4,904 | $365,000 | $261,699 | $103,301 |
| 2015 | $4,736 | $350,000 | $200,000 | $150,000 |
| 2014 | $3,618 | $250,500 | $179,604 | $70,896 |
Source: Public Records
Map
Nearby Homes
- 352 Winslow St
- 66 Baldwin Ave
- 240 Alexander St
- 414 Bay St
- 982 Juniper Ct
- 0 Rolph Park Dr Unit 225093212
- 0 Rolph Park Dr Unit IV25158147
- 1253 Flora St
- 611 Sea Ranch Ct Unit 6
- 2012 Glen Cove Rd
- 153 Camino Del Sol
- 254 Clearview Dr
- 1201 Glen Cove Pkwy Unit 1609
- 1201 Glen Cove Pkwy Unit 1809
- 1201 Glen Cove Pkwy Unit 514
- 1201 Glen Cove Pkwy Unit 602
- 1201 Glen Cove Pkwy Unit 1714
- 1201 Glen Cove Pkwy Unit 1001
- 125 Kendall Ave
- 104 Bridgeview Ct