Estimated Value: $336,115
About This Home
Property Id: 1668728
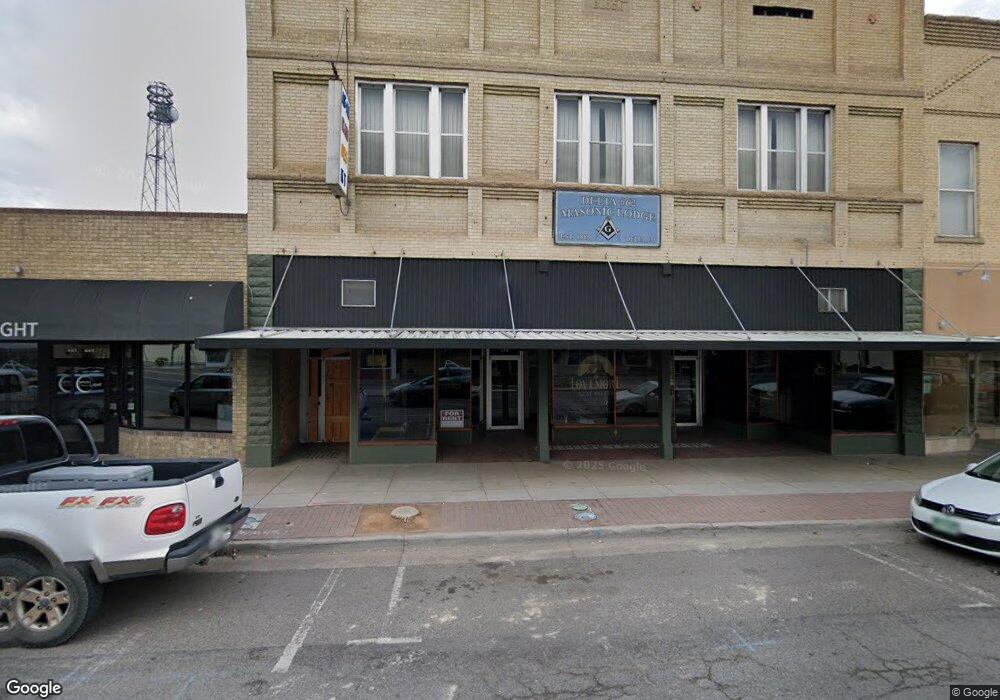
Looking for a unique business space? Built in 1908 and located in the heart of Main Street, this 6,000 sq. ft. building features an open floorplan ready for customization. Currently, 3,000 sq. ft. is available, with the option to expand. The storefront includes full window displays, a loft for office use, a back kitchen/break room, updated bathrooms, and a full basement for potential temperature-controlled storage. Original tin ceilings above the dropped ceiling can be exposed for a stunning 13' height. Delta is actively driving growth in this area, making it the perfect time to invest.
Recent updates include finished bathrooms, new flooring, and ongoing work on the entrance and tin ceiling restoration. With tons of character, this historic building—one of Delta's first—is conveniently located near the Egyptian Theater and excellent restaurants. Don't miss out on this incredible opportunity!
Ownership History
Purchase Details
Home Values in the Area
Average Home Value in this Area
Purchase History
| Date | Buyer | Sale Price | Title Company |
|---|---|---|---|
| Sorensen-Bain Investments Llc | $315,000 | None Listed On Document |
Property History
| Date | Event | Price | List to Sale | Price per Sq Ft |
|---|---|---|---|---|
| 12/28/2024 12/28/24 | Off Market | $2,250 | -- | -- |
| 12/11/2024 12/11/24 | For Rent | $2,250 | 0.0% | -- |
| 11/29/2024 11/29/24 | Off Market | $2,250 | -- | -- |
| 11/23/2024 11/23/24 | For Rent | $2,250 | -- | -- |
Tax History Compared to Growth
Tax History
| Year | Tax Paid | Tax Assessment Tax Assessment Total Assessment is a certain percentage of the fair market value that is determined by local assessors to be the total taxable value of land and additions on the property. | Land | Improvement |
|---|---|---|---|---|
| 2024 | $5,131 | $77,526 | $8,370 | $69,156 |
| 2023 | $5,131 | $77,526 | $8,370 | $69,156 |
| 2022 | $6,093 | $94,392 | $8,700 | $85,692 |
| 2021 | $1,973 | $94,392 | $8,700 | $85,692 |
| 2020 | $2,177 | $102,629 | $11,020 | $91,609 |
| 2019 | $2,154 | $102,629 | $11,020 | $91,609 |
| 2018 | $2,369 | $108,805 | $11,020 | $97,785 |
| 2017 | $2,301 | $108,805 | $11,020 | $97,785 |
| 2016 | $2,153 | $111,486 | $11,020 | $100,466 |
| 2014 | -- | $92,807 | $12,180 | $80,627 |