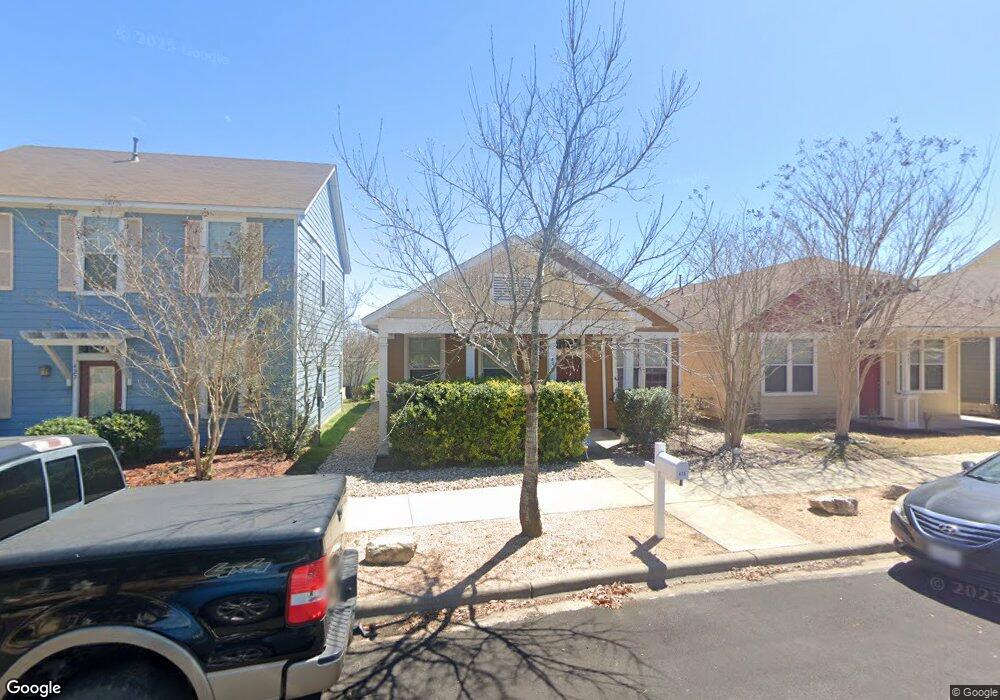
435 McGrarity Kyle, TX 78640
Plum Creek NeighborhoodEstimated Value: $295,000
3
Beds
2
Baths
1,204
Sq Ft
$245/Sq Ft
Est. Value
About This Home
This home is located at 435 McGrarity, Kyle, TX 78640 and is currently priced at $295,000, approximately $245 per square foot. 435 McGrarity is a home located in Hays County with nearby schools including Laura B Negley Elementary School, R C Barton Middle School, and Jack C Hays High School.
Ownership History
Date
Name
Owned For
Owner Type
Purchase Details
Closed on
May 23, 2022
Sold by
Wilson Jr Eugene C
Bought by
Op Gold Llc
Current Estimated Value
Purchase Details
Closed on
May 4, 2012
Sold by
Plum Creek Bh Llc
Bought by
Wilson Eugene C
Home Financials for this Owner
Home Financials are based on the most recent Mortgage that was taken out on this home.
Original Mortgage
$132,653
Interest Rate
4.02%
Mortgage Type
New Conventional
Purchase Details
Closed on
Oct 25, 2011
Sold by
Plum Creek Development Partners Ltd
Bought by
Wilson Eugene C
Create a Home Valuation Report for This Property
The Home Valuation Report is an in-depth analysis detailing your home's value as well as a comparison with similar homes in the area
Home Values in the Area
Average Home Value in this Area
Purchase History
| Date | Buyer | Sale Price | Title Company |
|---|---|---|---|
| Op Gold Llc | -- | First American Title | |
| Wilson Eugene C | -- | San Marcos Title Co | |
| Wilson Eugene C | -- | -- |
Source: Public Records
Mortgage History
| Date | Status | Borrower | Loan Amount |
|---|---|---|---|
| Previous Owner | Wilson Eugene C | $132,653 |
Source: Public Records
Tax History Compared to Growth
Tax History
| Year | Tax Paid | Tax Assessment Tax Assessment Total Assessment is a certain percentage of the fair market value that is determined by local assessors to be the total taxable value of land and additions on the property. | Land | Improvement |
|---|---|---|---|---|
| 2025 | $5,992 | $266,003 | $70,800 | $195,203 |
| 2024 | $5,992 | $265,660 | $70,800 | $194,860 |
| 2023 | $6,795 | $304,170 | $88,500 | $215,670 |
| 2022 | $5,342 | $219,482 | $75,000 | $225,530 |
| 2021 | $5,294 | $199,529 | $39,200 | $174,250 |
| 2020 | $4,435 | $181,390 | $29,400 | $151,990 |
| 2019 | $5,186 | $187,740 | $29,400 | $158,340 |
| 2018 | $4,963 | $179,200 | $21,000 | $158,200 |
| 2017 | $4,717 | $167,321 | $21,000 | $151,780 |
| 2016 | $4,288 | $152,110 | $21,000 | $131,110 |
| 2015 | $3,242 | $138,424 | $21,000 | $124,150 |
Source: Public Records
Map
Nearby Homes