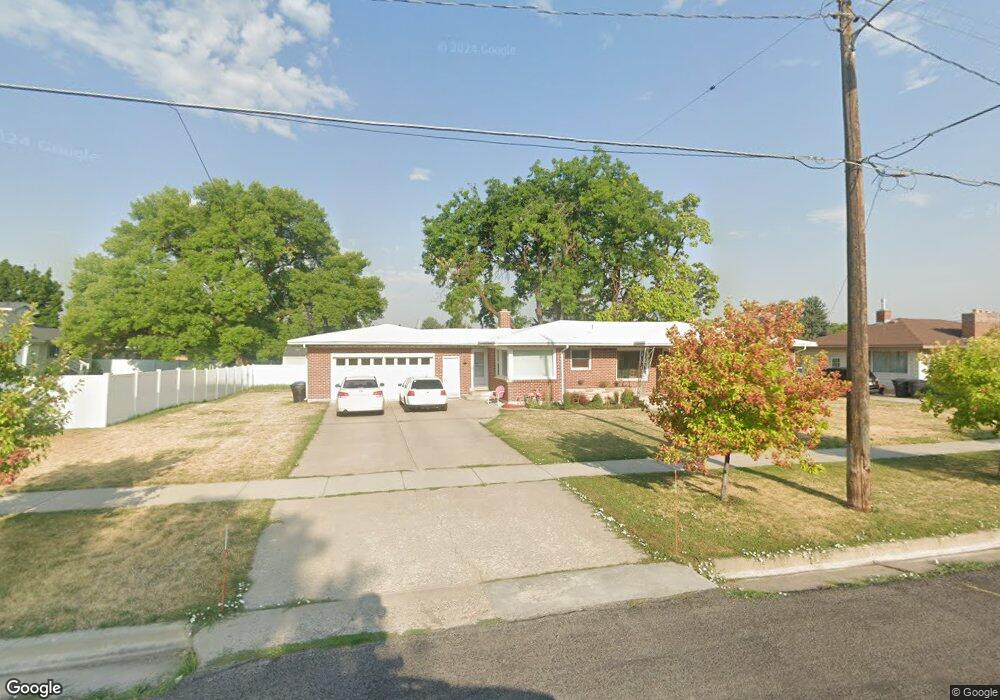
435 N 400 W Logan, UT 84321
Ellis NeighborhoodEstimated Value: $437,000 - $450,000
3
Beds
2
Baths
3,030
Sq Ft
$147/Sq Ft
Est. Value
About This Home
This home is located at 435 N 400 W, Logan, UT 84321 and is currently estimated at $444,331, approximately $146 per square foot. 435 N 400 W is a home located in Cache County with nearby schools including Ellis School, Mount Logan Middle School, and Logan High School.
Ownership History
Date
Name
Owned For
Owner Type
Purchase Details
Closed on
Aug 18, 2020
Sold by
Derrick Dale A and Derrick Julie M
Bought by
Wolfe Haiko
Current Estimated Value
Home Financials for this Owner
Home Financials are based on the most recent Mortgage that was taken out on this home.
Original Mortgage
$333,292
Outstanding Balance
$292,979
Interest Rate
3%
Mortgage Type
New Conventional
Estimated Equity
$151,352
Purchase Details
Closed on
Apr 23, 2013
Sold by
Merback Dixie Ann Lapray and Glen M & Ruby E Lapray Family
Bought by
Derrick Dale A and Derrick Julie M
Home Financials for this Owner
Home Financials are based on the most recent Mortgage that was taken out on this home.
Original Mortgage
$170,848
Interest Rate
3.75%
Mortgage Type
FHA
Purchase Details
Closed on
Apr 19, 2006
Sold by
Hansen Brad S and Hansen Cindy S
Bought by
Hansen Cindy and The Cindy Hansen Revocable Tru
Create a Home Valuation Report for This Property
The Home Valuation Report is an in-depth analysis detailing your home's value as well as a comparison with similar homes in the area
Home Values in the Area
Average Home Value in this Area
Purchase History
| Date | Buyer | Sale Price | Title Company |
|---|---|---|---|
| Wolfe Haiko | -- | Northern Title Company | |
| Derrick Dale A | -- | Pinnacle Title Ins Agency | |
| Hansen Cindy | -- | None Available |
Source: Public Records
Mortgage History
| Date | Status | Borrower | Loan Amount |
|---|---|---|---|
| Open | Wolfe Haiko | $333,292 | |
| Previous Owner | Derrick Dale A | $170,848 |
Source: Public Records
Tax History
| Year | Tax Paid | Tax Assessment Tax Assessment Total Assessment is a certain percentage of the fair market value that is determined by local assessors to be the total taxable value of land and additions on the property. | Land | Improvement |
|---|---|---|---|---|
| 2025 | $1,902 | $246,035 | $0 | $0 |
| 2024 | $196 | $246,035 | $0 | $0 |
| 2023 | $2,052 | $244,965 | $0 | $0 |
| 2022 | $2,197 | $244,965 | $0 | $0 |
| 2021 | $1,759 | $302,920 | $45,000 | $257,920 |
| 2020 | $1,570 | $243,400 | $45,000 | $198,400 |
| 2019 | $1,641 | $243,400 | $45,000 | $198,400 |
| 2018 | $1,442 | $195,304 | $45,000 | $150,304 |
| 2017 | $1,376 | $98,560 | $0 | $0 |
| 2016 | $1,427 | $93,060 | $0 | $0 |
| 2015 | $1,349 | $93,060 | $0 | $0 |
| 2014 | $1,219 | $93,060 | $0 | $0 |
| 2013 | -- | $89,750 | $0 | $0 |
Source: Public Records
Map
Nearby Homes
Your Personal Tour Guide
Ask me questions while you tour the home.