P
Seller's Agent in 2014
Paul Starr
Dropped Members
Estimated Value: $65,000 - $90,000
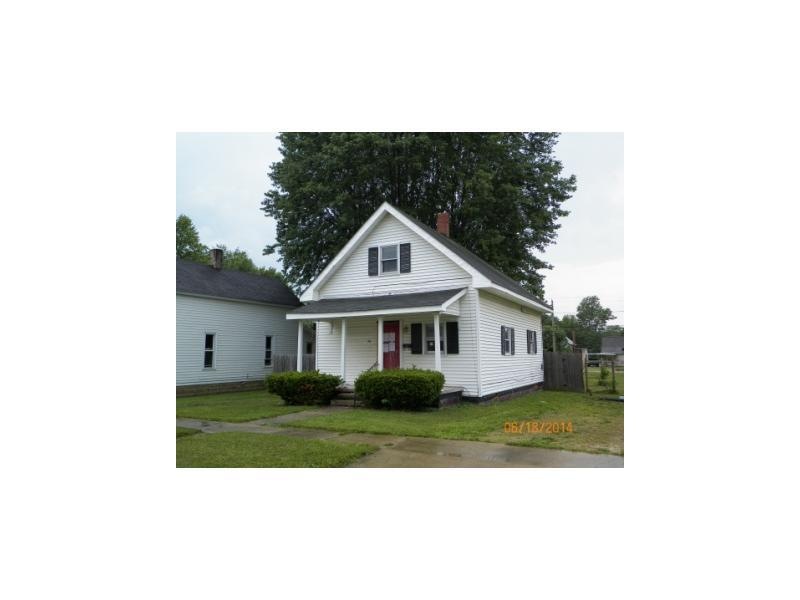
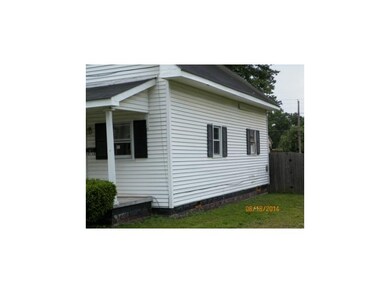
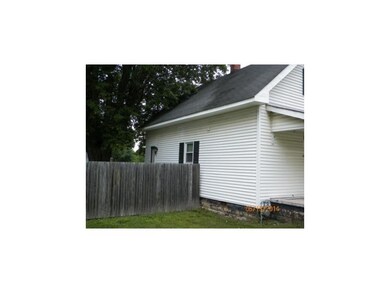
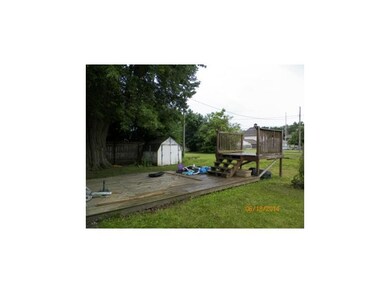
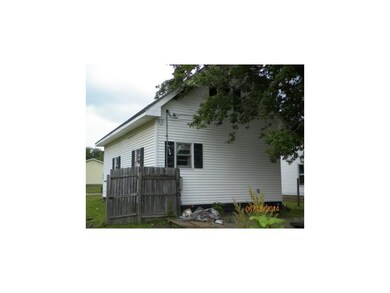
This home is located at 435 N Maple St, Winchester, IN 47394 since 08 July 2014 and is currently estimated at $81,751, approximately $68 per square foot. This property was built in 1900. 435 N Maple St is a home located in Randolph County with nearby schools including Winchester Community High School.
Last Agent to Sell the Property
Paul Starr
Dropped Members License #RB14037098 Listed on: 07/08/2014
Last Buyer's Agent
Paul Starr
Dropped Members License #RB14037098 Listed on: 07/08/2014
| Date | Buyer | Sale Price | Title Company |
|---|---|---|---|
| Miller Bryce A | -- | None Listed On Document | |
| Anderson Amy | -- | None Available | |
| The Bank Of New York Mellon | $18,000 | None Available |
| Date | Status | Borrower | Loan Amount |
|---|---|---|---|
| Open | Miller Bryce A | $78,551 |
| Date | Event | Price | List to Sale | Price per Sq Ft |
|---|---|---|---|---|
| 10/27/2014 10/27/14 | Sold | $6,300 | 0.0% | $5 / Sq Ft |
| 10/06/2014 10/06/14 | Pending | -- | -- | -- |
| 10/06/2014 10/06/14 | Off Market | $6,300 | -- | -- |
| 08/19/2014 08/19/14 | Price Changed | $10,000 | -23.1% | $8 / Sq Ft |
| 07/31/2014 07/31/14 | Price Changed | $13,000 | -23.1% | $11 / Sq Ft |
| 07/21/2014 07/21/14 | Price Changed | $16,900 | -15.1% | $14 / Sq Ft |
| 07/08/2014 07/08/14 | For Sale | $19,900 | -- | $17 / Sq Ft |
| Year | Tax Paid | Tax Assessment Tax Assessment Total Assessment is a certain percentage of the fair market value that is determined by local assessors to be the total taxable value of land and additions on the property. | Land | Improvement |
|---|---|---|---|---|
| 2025 | $625 | $32,500 | $2,900 | $29,600 |
| 2024 | $625 | $31,000 | $6,600 | $24,400 |
| 2023 | $581 | $28,800 | $6,600 | $22,200 |
| 2022 | $535 | $26,700 | $6,600 | $20,100 |
| 2021 | $535 | $26,700 | $7,700 | $19,000 |
| 2020 | $521 | $26,000 | $7,300 | $18,700 |
| 2019 | $497 | $24,800 | $6,100 | $18,700 |
| 2018 | $589 | $28,700 | $5,500 | $23,200 |
| 2017 | $587 | $28,600 | $5,500 | $23,100 |
| 2016 | $571 | $27,800 | $5,300 | $22,500 |
| 2014 | -- | $25,500 | $5,300 | $20,200 |
| 2013 | -- | $24,900 | $5,300 | $19,600 |
P
Seller's Agent in 2014
Paul Starr
Dropped Members
Source: MIBOR Broker Listing Cooperative®
MLS Number: MBR21302404
APN: 68-09-21-229-075.000-021
Disclaimer: Certain information contained herein is derived from information provided by parties other than Homes.com. All information provided is deemed reliable, but is not guaranteed to be accurate and should be independently verified.
![]() Based on information submitted to the MLS GRID. All data is obtained from various sources and may not have been verified by broker or MLS GRID. Supplied Open House Information is subject to change without notice. All information should be independently reviewed and verified for accuracy. Properties may or may not be listed by the office/agent presenting the information. Some IDX listings have been excluded from this website.
Based on information submitted to the MLS GRID. All data is obtained from various sources and may not have been verified by broker or MLS GRID. Supplied Open House Information is subject to change without notice. All information should be independently reviewed and verified for accuracy. Properties may or may not be listed by the office/agent presenting the information. Some IDX listings have been excluded from this website.
Based on information submitted to the MLS GRID
Ask me questions while you tour the home.
