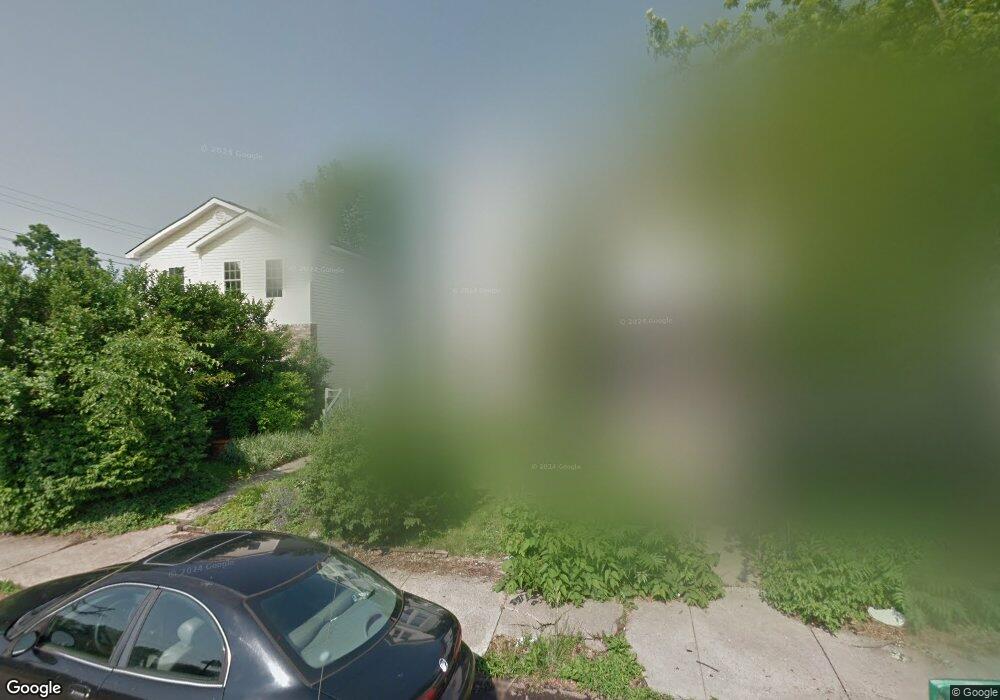
435 N Monroe Ave Columbus, OH 43203
Mount Vernon NeighborhoodEstimated Value: $239,000 - $331,000
3
Beds
2
Baths
2,296
Sq Ft
$121/Sq Ft
Est. Value
About This Home
This home is located at 435 N Monroe Ave, Columbus, OH 43203 and is currently estimated at $277,373, approximately $120 per square foot. 435 N Monroe Ave is a home located in Franklin County with nearby schools including Trevitt Elementary School, Champion Middle School, and East High School.
Ownership History
Date
Name
Owned For
Owner Type
Purchase Details
Closed on
Jun 30, 2025
Sold by
Jackson Danelle K and Jackson Derek
Bought by
Jackson Derek and Jackson Danelle K
Current Estimated Value
Home Financials for this Owner
Home Financials are based on the most recent Mortgage that was taken out on this home.
Original Mortgage
$66,300
Outstanding Balance
$65,844
Interest Rate
6.03%
Mortgage Type
New Conventional
Estimated Equity
$211,529
Purchase Details
Closed on
May 22, 2000
Sold by
Ware Michael
Bought by
Jackson Danelle K
Home Financials for this Owner
Home Financials are based on the most recent Mortgage that was taken out on this home.
Original Mortgage
$79,400
Interest Rate
8.13%
Mortgage Type
FHA
Purchase Details
Closed on
Dec 18, 1996
Sold by
Nusbaum Scott E
Bought by
Michael Ware
Home Financials for this Owner
Home Financials are based on the most recent Mortgage that was taken out on this home.
Original Mortgage
$49,150
Interest Rate
7.74%
Mortgage Type
FHA
Create a Home Valuation Report for This Property
The Home Valuation Report is an in-depth analysis detailing your home's value as well as a comparison with similar homes in the area
Home Values in the Area
Average Home Value in this Area
Purchase History
| Date | Buyer | Sale Price | Title Company |
|---|---|---|---|
| Jackson Derek | -- | States Title | |
| Jackson Danelle K | $65,000 | Midland Celtic Title | |
| Michael Ware | $48,900 | -- |
Source: Public Records
Mortgage History
| Date | Status | Borrower | Loan Amount |
|---|---|---|---|
| Open | Jackson Derek | $66,300 | |
| Previous Owner | Jackson Danelle K | $79,400 | |
| Previous Owner | Michael Ware | $49,150 |
Source: Public Records
Tax History Compared to Growth
Tax History
| Year | Tax Paid | Tax Assessment Tax Assessment Total Assessment is a certain percentage of the fair market value that is determined by local assessors to be the total taxable value of land and additions on the property. | Land | Improvement |
|---|---|---|---|---|
| 2024 | $3,633 | $80,960 | $22,050 | $58,910 |
| 2023 | $3,587 | $80,960 | $22,050 | $58,910 |
| 2022 | $1,405 | $27,090 | $1,330 | $25,760 |
| 2021 | $1,408 | $27,090 | $1,330 | $25,760 |
| 2020 | $1,409 | $27,090 | $1,330 | $25,760 |
| 2019 | $1,370 | $22,580 | $1,120 | $21,460 |
| 2018 | $1,074 | $22,580 | $1,120 | $21,460 |
| 2017 | $1,369 | $22,580 | $1,120 | $21,460 |
| 2016 | $861 | $12,990 | $2,000 | $10,990 |
| 2015 | $781 | $12,990 | $2,000 | $10,990 |
| 2014 | $783 | $12,990 | $2,000 | $10,990 |
| 2013 | $406 | $13,650 | $2,100 | $11,550 |
Source: Public Records
Map
Nearby Homes
- 427 N Garfield Ave
- 865 Old Leonard Ave
- 423 Saint Clair Ave
- 0 N Monroe Ave
- 456 Saint Clair Ave
- 529 Saint Clair Ave
- 1290 Mount Vernon Ave
- 262 N 17th St
- 247 N 17th St Unit 247
- 241 N 17th St
- 376 N Garfield Ave Unit 78
- 191 Talmadge St
- 262 N 21st St
- 166 Miami Ave
- 00 Atcheson St
- 1198 Atcheson St
- 0 Atcheson St Unit 224009260
- 176 N 20th St
- 144 Miami Ave
- 40 Miami Ave Unit 238
- 441 N Monroe Ave
- 431 N Monroe Ave
- 427 N Monroe Ave
- 443 N Monroe Ave Unit 445
- 890 Atcheson St
- 447 N Monroe Ave
- 453 N Monroe Ave
- 417 N Monroe Ave Unit 419
- 887 Atcheson St
- 444 N Garfield Ave Unit 446
- 448 N Garfield Ave Unit 450
- 440 N Garfield Ave Unit 442
- 448-450 N Garfield Ave
- 452 N Garfield Ave
- 457 N Monroe Ave
- 436 N Garfield Ave Unit 436 & 438
- 436 N Garfield Ave Unit 2
- 881 Atcheson St
- 456 N Garfield Ave Unit 458