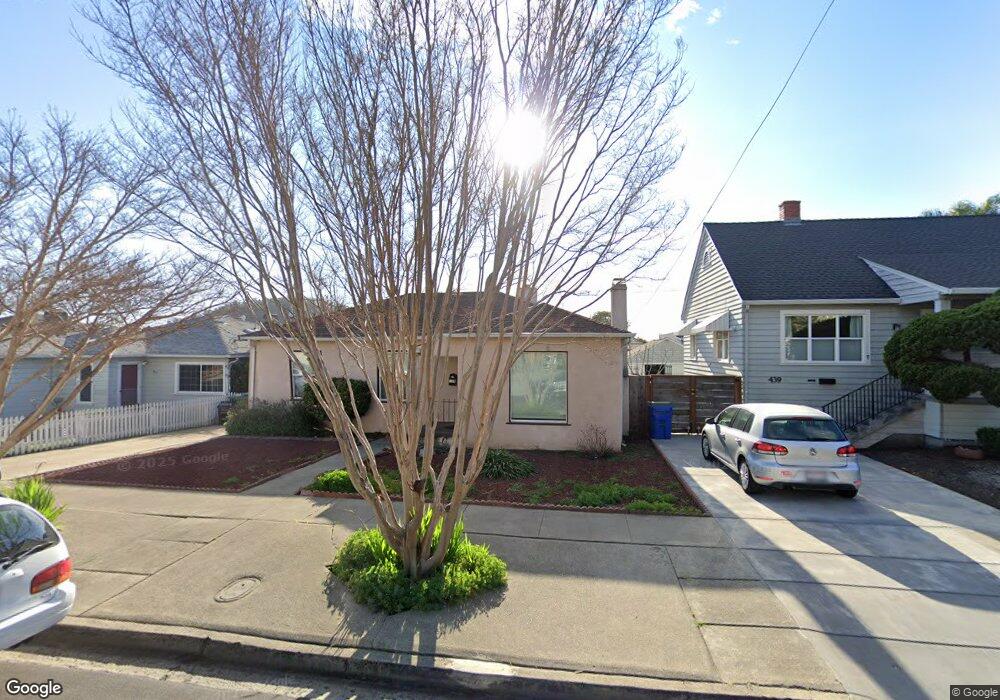
435 Norvell St El Cerrito, CA 94530
Estimated Value: $959,000 - $1,108,160
2
Beds
2
Baths
1,236
Sq Ft
$842/Sq Ft
Est. Value
About This Home
This home is located at 435 Norvell St, El Cerrito, CA 94530 and is currently estimated at $1,040,790, approximately $842 per square foot. 435 Norvell St is a home located in Contra Costa County with nearby schools including Harding Elementary School, Fred T. Korematsu Middle School, and El Cerrito Senior High School.
Ownership History
Date
Name
Owned For
Owner Type
Purchase Details
Closed on
Feb 21, 2007
Sold by
Jackson Shawn Joseph and Jackson Shawn J
Bought by
Jackson Shawn Joseph
Current Estimated Value
Home Financials for this Owner
Home Financials are based on the most recent Mortgage that was taken out on this home.
Original Mortgage
$330,000
Outstanding Balance
$198,205
Interest Rate
6.21%
Mortgage Type
Stand Alone Refi Refinance Of Original Loan
Estimated Equity
$842,585
Purchase Details
Closed on
Jul 13, 2006
Sold by
Nelson Lucille
Bought by
Jackson Shawn J
Home Financials for this Owner
Home Financials are based on the most recent Mortgage that was taken out on this home.
Original Mortgage
$274,000
Interest Rate
6.57%
Mortgage Type
Purchase Money Mortgage
Create a Home Valuation Report for This Property
The Home Valuation Report is an in-depth analysis detailing your home's value as well as a comparison with similar homes in the area
Home Values in the Area
Average Home Value in this Area
Purchase History
| Date | Buyer | Sale Price | Title Company |
|---|---|---|---|
| Jackson Shawn Joseph | -- | First American Title Ins Co | |
| Jackson Shawn J | $575,000 | Old Republic Title Company |
Source: Public Records
Mortgage History
| Date | Status | Borrower | Loan Amount |
|---|---|---|---|
| Open | Jackson Shawn Joseph | $330,000 | |
| Closed | Jackson Shawn J | $274,000 |
Source: Public Records
Tax History Compared to Growth
Tax History
| Year | Tax Paid | Tax Assessment Tax Assessment Total Assessment is a certain percentage of the fair market value that is determined by local assessors to be the total taxable value of land and additions on the property. | Land | Improvement |
|---|---|---|---|---|
| 2025 | $10,816 | $770,356 | $645,097 | $125,259 |
| 2024 | $10,621 | $755,252 | $632,449 | $122,803 |
| 2023 | $10,621 | $740,445 | $620,049 | $120,396 |
| 2022 | $10,468 | $725,928 | $607,892 | $118,036 |
| 2021 | $10,430 | $711,695 | $595,973 | $115,722 |
| 2019 | $9,787 | $690,589 | $578,298 | $112,291 |
| 2018 | $9,448 | $677,049 | $566,959 | $110,090 |
| 2017 | $9,300 | $663,775 | $555,843 | $107,932 |
| 2016 | $9,273 | $650,761 | $544,945 | $105,816 |
| 2015 | $8,873 | $607,500 | $508,718 | $98,782 |
| 2014 | $8,511 | $575,000 | $481,503 | $93,497 |
Source: Public Records
Map
Nearby Homes
- 444 Richmond St
- 556 Norvell St
- 617 Albemarle St
- 619 Norvell St
- 618 Liberty St
- 10300 San Pablo Ave Unit 108
- 10300 San Pablo Ave Unit 303
- 417 Evelyn Ave Unit 205
- 115 Behrens St
- 7347 Terrace Dr
- 3014 Santa Clara Ave
- 6727 Waldo Ave
- 518 Kains Ave Unit 103
- 5720 El Dorado Ave
- 606 Masonic Ave
- 6124 Santa Cruz Ave
- 876 Balra Dr
- 951 Lexington Ave
- 7553 Stockton Ave
- 1252 Portland Ave