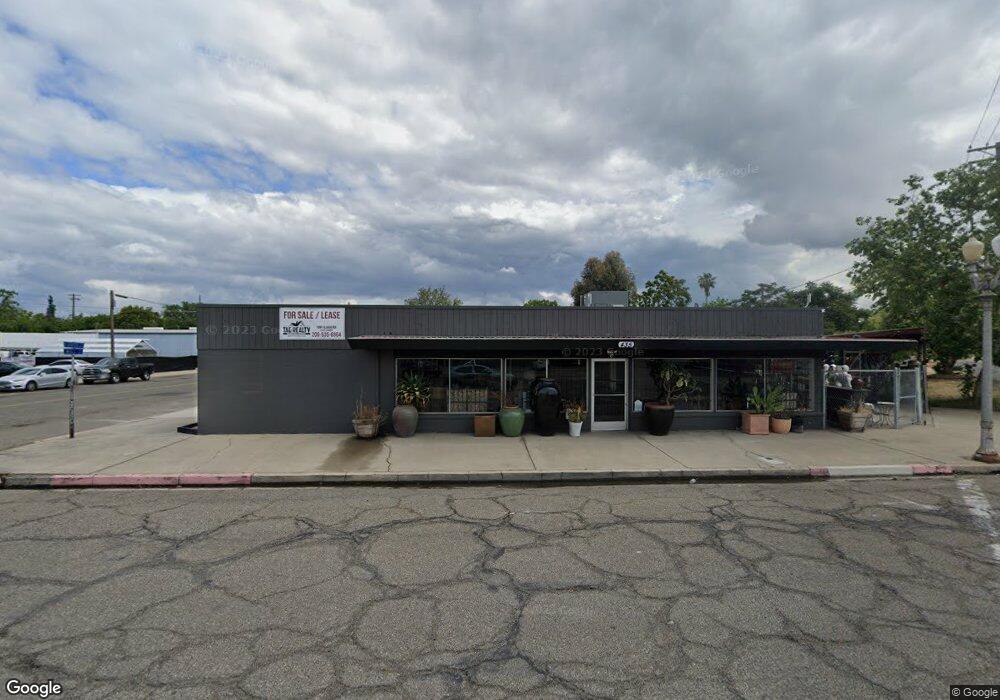
435 S Center St Turlock, CA 95380
Downtown Turlock NeighborhoodEstimated Value: $846,292
Studio
--
Bath
7,240
Sq Ft
$117/Sq Ft
Est. Value
About This Home
This home is located at 435 S Center St, Turlock, CA 95380 and is currently estimated at $846,292, approximately $116 per square foot. 435 S Center St is a home located in Stanislaus County with nearby schools including Julien Elementary School, Marvin A. Dutcher Middle School, and Turlock Junior High School.
Ownership History
Date
Name
Owned For
Owner Type
Purchase Details
Closed on
Aug 12, 2022
Sold by
Edward Campiotti
Bought by
Campiotti Family Trust
Current Estimated Value
Purchase Details
Closed on
Feb 22, 2022
Sold by
Vargas Antonio A and Vargas Mary A
Bought by
Campiotti Edward
Home Financials for this Owner
Home Financials are based on the most recent Mortgage that was taken out on this home.
Original Mortgage
$392,500
Interest Rate
3.55%
Mortgage Type
New Conventional
Purchase Details
Closed on
Aug 17, 2018
Sold by
Jsutus Micahel
Bought by
Vargas Antonio and Vargas Mary A
Home Financials for this Owner
Home Financials are based on the most recent Mortgage that was taken out on this home.
Original Mortgage
$520,000
Interest Rate
4.5%
Mortgage Type
Purchase Money Mortgage
Purchase Details
Closed on
Aug 19, 1999
Sold by
Justus Michael and Justus Nancy
Bought by
Justus Michael
Create a Home Valuation Report for This Property
The Home Valuation Report is an in-depth analysis detailing your home's value as well as a comparison with similar homes in the area
Home Values in the Area
Average Home Value in this Area
Purchase History
| Date | Buyer | Sale Price | Title Company |
|---|---|---|---|
| Campiotti Family Trust | -- | None Listed On Document | |
| Campiotti Edward | $785,000 | Old Republic Title | |
| Vargas Antonio | $630,000 | First American Title Co | |
| Justus Michael | -- | -- |
Source: Public Records
Mortgage History
| Date | Status | Borrower | Loan Amount |
|---|---|---|---|
| Previous Owner | Campiotti Edward | $392,500 | |
| Previous Owner | Vargas Antonio | $520,000 |
Source: Public Records
Tax History
| Year | Tax Paid | Tax Assessment Tax Assessment Total Assessment is a certain percentage of the fair market value that is determined by local assessors to be the total taxable value of land and additions on the property. | Land | Improvement |
|---|---|---|---|---|
| 2025 | $8,936 | $833,048 | $148,569 | $684,479 |
| 2024 | $8,770 | $816,714 | $145,656 | $671,058 |
| 2023 | $8,756 | $800,700 | $142,800 | $657,900 |
| 2022 | $7,295 | $662,241 | $194,467 | $467,774 |
| 2021 | $7,188 | $649,256 | $190,654 | $458,602 |
| 2020 | $7,138 | $642,600 | $188,700 | $453,900 |
| 2019 | $7,018 | $630,000 | $185,000 | $445,000 |
| 2018 | $1,819 | $159,465 | $58,378 | $101,087 |
| 2017 | $1,776 | $156,339 | $57,234 | $99,105 |
| 2016 | $1,659 | $153,274 | $56,112 | $97,162 |
| 2015 | $1,643 | $150,973 | $55,270 | $95,703 |
| 2014 | $1,627 | $148,017 | $54,188 | $93,829 |
Source: Public Records
Map
Nearby Homes
Your Personal Tour Guide
Ask me questions while you tour the home.