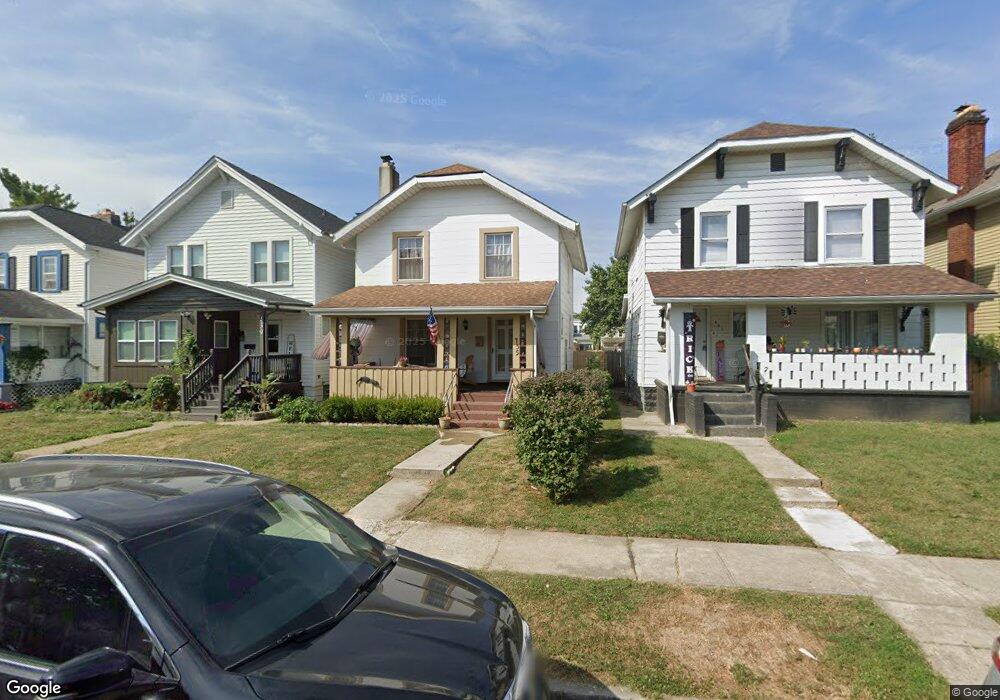
435 S Richardson Ave Columbus, OH 43204
Central Hilltop NeighborhoodEstimated Value: $133,598 - $142,000
3
Beds
1
Bath
1,144
Sq Ft
$120/Sq Ft
Est. Value
About This Home
This home is located at 435 S Richardson Ave, Columbus, OH 43204 and is currently estimated at $137,400, approximately $120 per square foot. 435 S Richardson Ave is a home located in Franklin County with nearby schools including Burroughs Elementary School, Hilltonia Middle School, and Briggs High School.
Ownership History
Date
Name
Owned For
Owner Type
Purchase Details
Closed on
Jan 25, 2011
Sold by
Hamilton Jeffrey
Bought by
Hamilton Jeffrey and Hamilton Brenda
Current Estimated Value
Purchase Details
Closed on
Jul 13, 2004
Sold by
The Provident Bank
Bought by
Hamilton Jeffrey
Home Financials for this Owner
Home Financials are based on the most recent Mortgage that was taken out on this home.
Original Mortgage
$52,000
Outstanding Balance
$29,528
Interest Rate
8.37%
Mortgage Type
Purchase Money Mortgage
Estimated Equity
$107,872
Purchase Details
Closed on
Apr 29, 2004
Sold by
Abram Jack and Case #03Cve10 11154
Bought by
The Provident Bank
Purchase Details
Closed on
May 14, 1999
Sold by
Homes On The Hill Community Development
Bought by
Abram Jack and Abram Melissa
Home Financials for this Owner
Home Financials are based on the most recent Mortgage that was taken out on this home.
Original Mortgage
$50,400
Interest Rate
11.75%
Purchase Details
Closed on
Jul 26, 1989
Create a Home Valuation Report for This Property
The Home Valuation Report is an in-depth analysis detailing your home's value as well as a comparison with similar homes in the area
Home Values in the Area
Average Home Value in this Area
Purchase History
| Date | Buyer | Sale Price | Title Company |
|---|---|---|---|
| Hamilton Jeffrey | -- | Attorney | |
| Hamilton Jeffrey | $52,000 | Amerititle | |
| The Provident Bank | $49,900 | Fidelity National Title Insu | |
| Abram Jack | $50,500 | -- | |
| -- | $37,900 | -- |
Source: Public Records
Mortgage History
| Date | Status | Borrower | Loan Amount |
|---|---|---|---|
| Open | Hamilton Jeffrey | $52,000 | |
| Previous Owner | Abram Jack | $50,400 |
Source: Public Records
Tax History Compared to Growth
Tax History
| Year | Tax Paid | Tax Assessment Tax Assessment Total Assessment is a certain percentage of the fair market value that is determined by local assessors to be the total taxable value of land and additions on the property. | Land | Improvement |
|---|---|---|---|---|
| 2024 | $1,201 | $36,550 | $5,570 | $30,980 |
| 2023 | $1,213 | $36,540 | $5,565 | $30,975 |
| 2022 | $441 | $17,260 | $1,790 | $15,470 |
| 2021 | $442 | $17,260 | $1,790 | $15,470 |
| 2020 | $443 | $17,260 | $1,790 | $15,470 |
| 2019 | $335 | $14,280 | $1,470 | $12,810 |
| 2018 | $379 | $14,280 | $1,470 | $12,810 |
| 2017 | $335 | $14,280 | $1,470 | $12,810 |
| 2016 | $466 | $15,790 | $3,960 | $11,830 |
| 2015 | $423 | $15,790 | $3,960 | $11,830 |
| 2014 | $424 | $15,790 | $3,960 | $11,830 |
| 2013 | $293 | $18,585 | $4,655 | $13,930 |
Source: Public Records
Map
Nearby Homes
- 405 S Burgess Ave
- 397 S Burgess Ave
- 471 S Terrace Ave Unit 473
- 444 S Warren Ave
- 448 S Warren Ave
- 418 S Warren Ave
- 365 S Ogden Ave
- 350 S Ogden Ave
- 500 S Warren Ave
- 540 S Richardson Ave
- 510 S Warren Ave
- 554 S Ogden Ave
- 310 S Ogden Ave
- 334 S Warren Ave
- 426 S Eureka Ave
- 349 S Eureka Ave
- 2715 Sullivant Ave
- 389 S Harris Ave
- 599 S Burgess Ave Unit 601
- 274 S Richardson Ave
- 431 S Richardson Ave
- 427 S Richardson Ave
- 443 S Richardson Ave
- 423 S Richardson Ave
- 447 S Richardson Ave
- 419 S Richardson Ave
- 451 S Richardson Ave
- 436 S Burgess Ave
- 415 S Richardson Ave
- 455 S Richardson Ave
- 440 S Burgess Ave
- 428 S Burgess Ave
- 444 S Burgess Ave
- 448 S Burgess Ave
- 459 S Richardson Ave
- 420 S Burgess Ave
- 452 S Burgess Ave
- 436 S Richardson Ave Unit 438
- 436-438 S Richardson Ave
- 432 S Richardson Ave