Estimated Value: $576,195 - $642,000
2
Beds
1
Bath
858
Sq Ft
$704/Sq Ft
Est. Value
About This Home
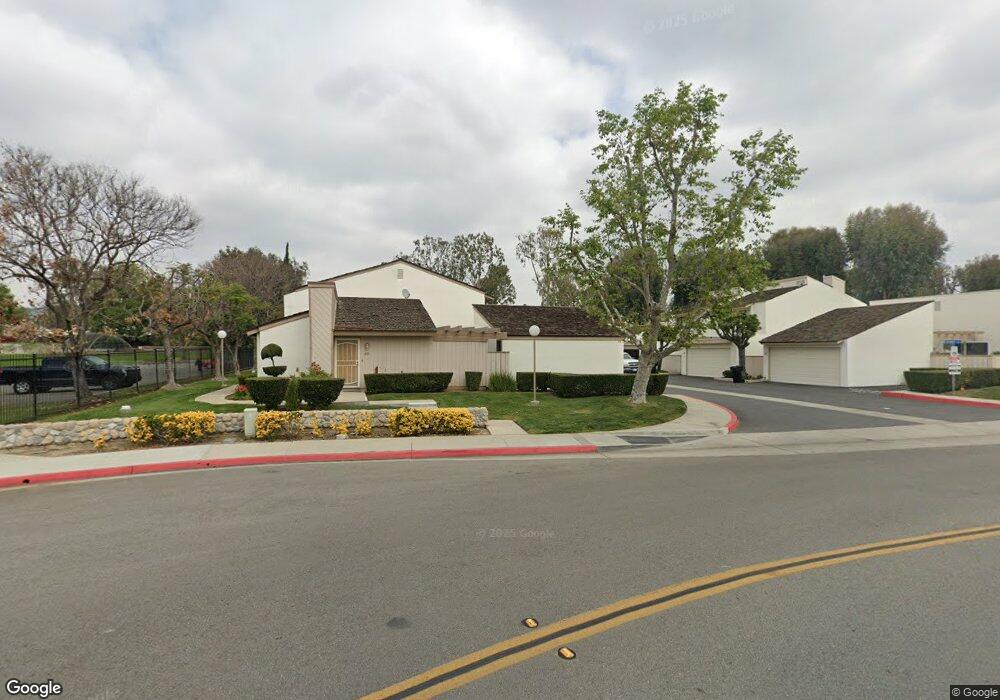
This home is located at 435 Shady Ct, Brea, CA 92821 and is currently estimated at $604,049, approximately $704 per square foot. 435 Shady Ct is a home located in Orange County with nearby schools including William E. Fanning Elementary School, Brea Junior High School, and Brea-Olinda High School.
Ownership History
Date
Name
Owned For
Owner Type
Purchase Details
Closed on
Dec 9, 2015
Sold by
Kuusto John Anthony
Bought by
Kuusto John A and The John A Kuusto Trust
Current Estimated Value
Purchase Details
Closed on
Oct 12, 2009
Sold by
Kuusto Ivanka
Bought by
Kuusto Ivanka and Kuusto John Anthony
Purchase Details
Closed on
Mar 10, 2005
Sold by
Farias Lilia
Bought by
Kuusto Ivanka and Ivanka Kuusto Trust
Purchase Details
Closed on
Nov 30, 2000
Sold by
Richter Susan L
Bought by
Richter Susan L and The Susan L Richter Trust
Home Financials for this Owner
Home Financials are based on the most recent Mortgage that was taken out on this home.
Original Mortgage
$157,925
Interest Rate
7.71%
Mortgage Type
FHA
Purchase Details
Closed on
Nov 27, 2000
Sold by
Richter Susan L
Bought by
Farias Lilia
Home Financials for this Owner
Home Financials are based on the most recent Mortgage that was taken out on this home.
Original Mortgage
$157,925
Interest Rate
7.71%
Mortgage Type
FHA
Create a Home Valuation Report for This Property
The Home Valuation Report is an in-depth analysis detailing your home's value as well as a comparison with similar homes in the area
Home Values in the Area
Average Home Value in this Area
Purchase History
| Date | Buyer | Sale Price | Title Company |
|---|---|---|---|
| Kuusto John A | -- | None Available | |
| Kuusto Ivanka | -- | None Available | |
| Kuusto Ivanka | $335,000 | First Southwestern Title | |
| Richter Susan L | -- | Fidelity National Title Ins | |
| Farias Lilia | $159,000 | Fidelity National Title Ins |
Source: Public Records
Mortgage History
| Date | Status | Borrower | Loan Amount |
|---|---|---|---|
| Previous Owner | Farias Lilia | $157,925 |
Source: Public Records
Tax History
| Year | Tax Paid | Tax Assessment Tax Assessment Total Assessment is a certain percentage of the fair market value that is determined by local assessors to be the total taxable value of land and additions on the property. | Land | Improvement |
|---|---|---|---|---|
| 2025 | $1,609 | $113,262 | $40,832 | $72,430 |
| 2024 | $1,609 | $111,042 | $40,032 | $71,010 |
| 2023 | $1,563 | $108,865 | $39,247 | $69,618 |
| 2022 | $1,542 | $106,731 | $38,478 | $68,253 |
| 2021 | $1,515 | $104,639 | $37,724 | $66,915 |
| 2020 | $1,503 | $103,567 | $37,338 | $66,229 |
| 2019 | $1,471 | $101,537 | $36,606 | $64,931 |
| 2018 | $1,450 | $99,547 | $35,889 | $63,658 |
| 2017 | $1,424 | $97,596 | $35,186 | $62,410 |
| 2016 | $1,399 | $95,683 | $34,496 | $61,187 |
| 2015 | $1,301 | $94,246 | $33,978 | $60,268 |
| 2014 | $1,265 | $92,400 | $33,312 | $59,088 |
Source: Public Records
Map
Nearby Homes
- 360 Meadow Ct
- 673 Cliffwood Ave
- 640 Cliffwood Ave
- 500 Silver Canyon Way
- 600 N Brea Blvd Unit 50
- 600 Pepper Tree Dr
- 38 Rogers Ct
- 688 Buttonwood Dr
- 321 Blossom Place
- 233 Brookshire Place
- 145 S Poplar Ave Unit 20
- 215 Delphia Ave
- 127 S Redwood Ave
- 714 Brooklyn Dr
- 570 Olive Ave
- 1002 Mariposa Dr
- 753 Site Dr
- 448 W Central Ave
- 334 S Walnut Ave
- 421 Sycamore Ave
Your Personal Tour Guide
Ask me questions while you tour the home.