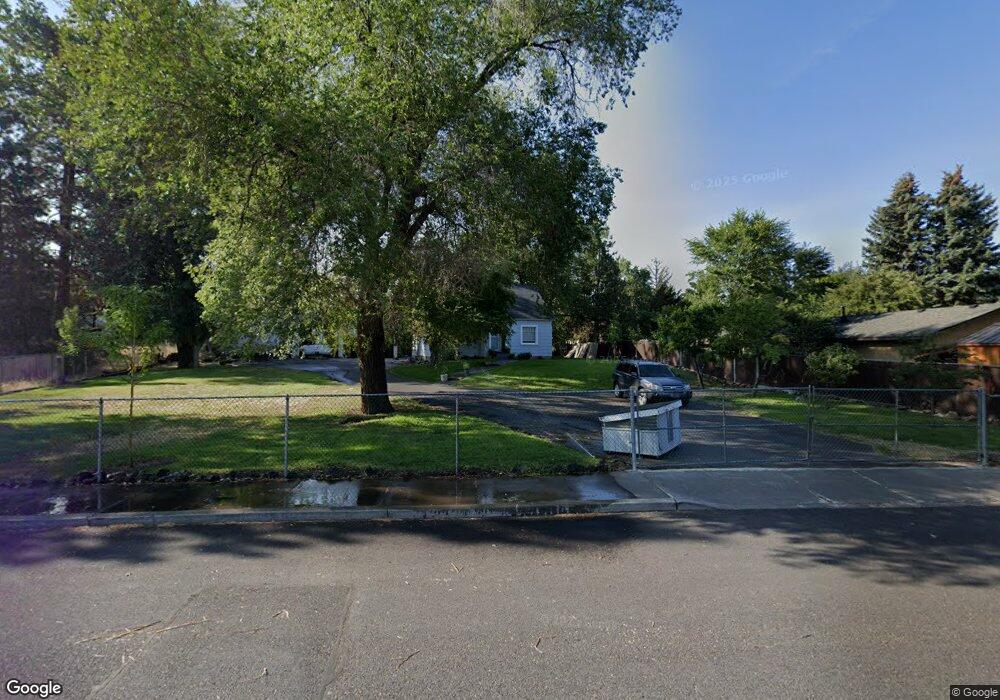
435 SW Blakely Ct Bend, OR 97702
Southern Crossing NeighborhoodEstimated Value: $641,187 - $717,000
3
Beds
2
Baths
920
Sq Ft
$740/Sq Ft
Est. Value
About This Home
This home is located at 435 SW Blakely Ct, Bend, OR 97702 and is currently estimated at $681,047, approximately $740 per square foot. 435 SW Blakely Ct is a home located in Deschutes County with nearby schools including Pine Ridge Elementary School, Cascade Middle School, and Bend Senior High School.
Ownership History
Date
Name
Owned For
Owner Type
Purchase Details
Closed on
Oct 24, 2016
Sold by
Gregg Jeffrey G and Gregg Mary L
Bought by
Gregg Jeffrey G and Gregg Mary L
Current Estimated Value
Purchase Details
Closed on
Mar 25, 2016
Sold by
Kutcher Lona J
Bought by
Gregg Jeffrey G and Gregg Mary L
Purchase Details
Closed on
Jan 26, 2011
Sold by
Ruedi Paul
Bought by
Gregg Jeffrey G and Gregg Mary L
Home Financials for this Owner
Home Financials are based on the most recent Mortgage that was taken out on this home.
Original Mortgage
$160,550
Interest Rate
4.82%
Mortgage Type
New Conventional
Create a Home Valuation Report for This Property
The Home Valuation Report is an in-depth analysis detailing your home's value as well as a comparison with similar homes in the area
Home Values in the Area
Average Home Value in this Area
Purchase History
| Date | Buyer | Sale Price | Title Company |
|---|---|---|---|
| Gregg Jeffrey G | -- | None Available | |
| Gregg Jeffrey G | -- | None Available | |
| Gregg Jeffrey G | $175,000 | Western Title & Escrow Co | |
| Ruedi Paul | -- | Accommodation |
Source: Public Records
Mortgage History
| Date | Status | Borrower | Loan Amount |
|---|---|---|---|
| Previous Owner | Gregg Jeffrey G | $160,550 |
Source: Public Records
Tax History Compared to Growth
Tax History
| Year | Tax Paid | Tax Assessment Tax Assessment Total Assessment is a certain percentage of the fair market value that is determined by local assessors to be the total taxable value of land and additions on the property. | Land | Improvement |
|---|---|---|---|---|
| 2025 | $3,329 | $197,020 | -- | -- |
| 2024 | $3,203 | $191,290 | -- | -- |
| 2023 | $2,969 | $185,720 | $0 | $0 |
| 2022 | $2,770 | $175,070 | $0 | $0 |
| 2021 | $2,774 | $169,980 | $0 | $0 |
| 2020 | $2,632 | $169,980 | $0 | $0 |
| 2019 | $2,559 | $165,030 | $0 | $0 |
| 2018 | $2,487 | $160,230 | $0 | $0 |
| 2017 | $2,414 | $155,565 | $0 | $0 |
| 2016 | $2,287 | $150,080 | $0 | $0 |
| 2015 | $2,224 | $145,710 | $0 | $0 |
| 2014 | $2,159 | $141,470 | $0 | $0 |
Source: Public Records
Map
Nearby Homes
- 1175 SW Chamberlain St
- 617 SW Peak View Place
- 1217 SW Bryanwood Place
- 892 SW Theater Dr
- 1283 SW Mill Pond Place Unit 100 200 300
- 897 SW Theater Dr
- 1217 SW Tanner Ct
- 61574 SW Blakely Rd
- 1317 SW Boardwalk Ln
- 334 SW Roosevelt Ave Unit 3
- 977 SW Hill St
- 20013 SW Pinewood Rd
- 1202 SW Mcclellan Ln
- 20192 Reed Ln
- 1063 SW Crosscut Ct
- 20001 Mcclellan Rd
- 8 SW Mckinley Ave
- 757 SW Pelton Place Unit 7
- 61521 Sunny Breeze Ln
- 20184 Merriewood Ln
- 505 SW Tenos Ct
- 431 SW Blakely Ct
- 507 SW Tenos Ct
- 494 SW Forest Grove Dr
- 476 SW Forest Grove Dr
- 423 SW Blakely Ct
- 430 SW Blakely Ct
- 509 SW Tenos Ct
- 500 SW Forest Grove Dr
- 470 SW Forest Grove Dr
- 421 SW Blakely Ct
- 515 SW Tenos Ct
- 444 SW Blakely Ct
- 506 SW Forest Grove Dr
- 466 SW Forest Grove Dr
- 1211 SW Forest Grove Dr
- 511 SW Tenos Ct
- 485 SW Forest Grove Dr
- 491 SW Forest Grove Dr
- 479 SW Forest Grove Dr