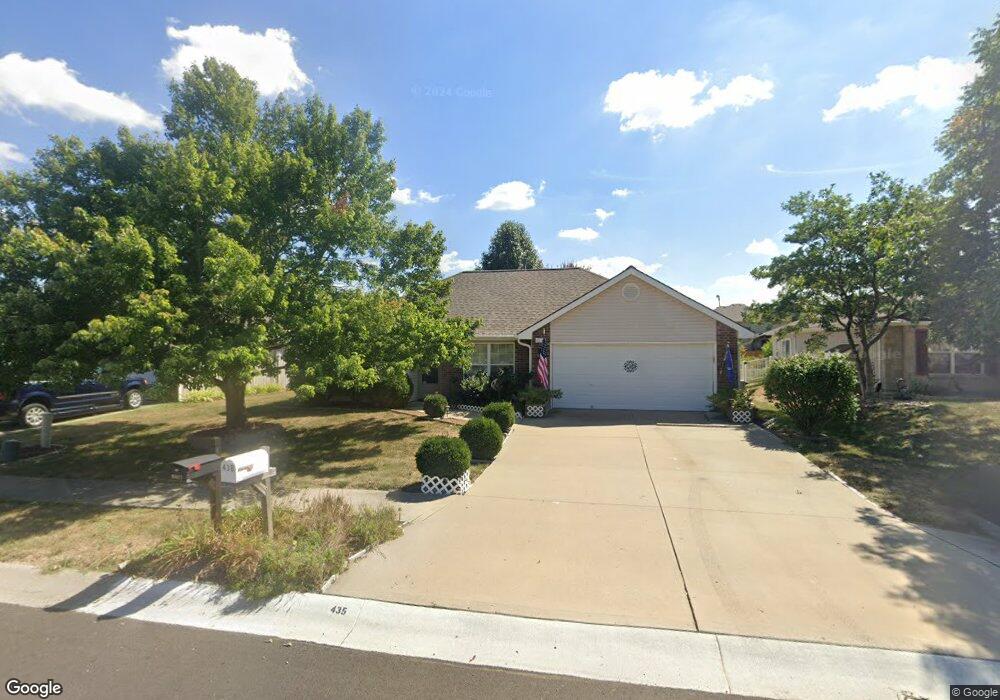
435 SW Laura Ln Grain Valley, MO 64029
Estimated Value: $278,077 - $307,000
3
Beds
2
Baths
1,348
Sq Ft
$217/Sq Ft
Est. Value
About This Home
This home is located at 435 SW Laura Ln, Grain Valley, MO 64029 and is currently estimated at $292,519, approximately $217 per square foot. 435 SW Laura Ln is a home located in Jackson County with nearby schools including Grain Valley High School.
Ownership History
Date
Name
Owned For
Owner Type
Purchase Details
Closed on
Nov 15, 2010
Sold by
Shatto Michelle L
Bought by
Morey Wayne A and Morey Ruth A
Current Estimated Value
Purchase Details
Closed on
Aug 16, 2007
Sold by
Us Bank Na
Bought by
Shatto Michelle L
Home Financials for this Owner
Home Financials are based on the most recent Mortgage that was taken out on this home.
Original Mortgage
$99,000
Interest Rate
6.72%
Mortgage Type
Seller Take Back
Purchase Details
Closed on
May 16, 2007
Sold by
Lowery Cassie and Lowery Michael
Bought by
Us Bank Na and Mlmi Surf Trust Series 2006-Ab1
Purchase Details
Closed on
Jul 30, 2004
Sold by
Ebert David J and Ebert Sherri S
Bought by
Lowery Michael and Lowery Cassie
Home Financials for this Owner
Home Financials are based on the most recent Mortgage that was taken out on this home.
Original Mortgage
$110,400
Interest Rate
6.83%
Mortgage Type
Purchase Money Mortgage
Create a Home Valuation Report for This Property
The Home Valuation Report is an in-depth analysis detailing your home's value as well as a comparison with similar homes in the area
Home Values in the Area
Average Home Value in this Area
Purchase History
| Date | Buyer | Sale Price | Title Company |
|---|---|---|---|
| Morey Wayne A | -- | First American Title | |
| Shatto Michelle L | -- | Mo Kan Title Services Inc | |
| Us Bank Na | $114,860 | None Available | |
| Lowery Michael | -- | Stewart Title |
Source: Public Records
Mortgage History
| Date | Status | Borrower | Loan Amount |
|---|---|---|---|
| Previous Owner | Shatto Michelle L | $99,000 | |
| Previous Owner | Lowery Michael | $110,400 | |
| Closed | Lowery Michael | $27,600 |
Source: Public Records
Tax History Compared to Growth
Tax History
| Year | Tax Paid | Tax Assessment Tax Assessment Total Assessment is a certain percentage of the fair market value that is determined by local assessors to be the total taxable value of land and additions on the property. | Land | Improvement |
|---|---|---|---|---|
| 2025 | $2,886 | $36,936 | $8,702 | $28,234 |
| 2024 | $2,778 | $35,042 | $3,526 | $31,516 |
| 2023 | $2,778 | $35,042 | $4,463 | $30,579 |
| 2022 | $2,532 | $27,930 | $4,706 | $23,224 |
| 2021 | $2,473 | $27,930 | $4,706 | $23,224 |
| 2020 | $2,500 | $27,855 | $4,706 | $23,149 |
| 2019 | $2,449 | $27,855 | $4,706 | $23,149 |
| 2018 | $2,281 | $24,242 | $4,095 | $20,147 |
| 2017 | $2,281 | $24,242 | $4,095 | $20,147 |
| 2016 | $2,140 | $22,752 | $4,784 | $17,968 |
| 2014 | $2,114 | $22,306 | $4,690 | $17,616 |
Source: Public Records
Map
Nearby Homes
- 636 SW Lakeview Dr
- 1024 Christie Ln
- 725 SW Tisha Ln
- 714 SW Brome Dr
- 640 SW Crestview Dr
- 209 SW Cross Creek Dr
- 1215 SW Lone Star Ct
- 509 SW Joseph Ct
- 200 Cross Creek Ln
- 207 Pebblebrook St
- 1214 SW Windcrest Ct
- 506 SW Meadowood Dr
- 1219 SW Windcrest Ct
- 621 SW Tisha Ln
- 913 SW Abar Dr
- 1203 SW Lakeview Dr
- 1418 SW Blue Branch Dr
- 1309 SW Graystone Cir
- 1001 SW Cross Creek Dr
- 401 S Minter Rd
- 433 SW Laura Ln
- 437 SW Laura Ln
- 431 SW Laura Ln
- 439 SW Laura Ln
- 438 SW Laura Ln
- 440 SW Laura Ln
- 434 SW Laura Ln
- 429 SW Laura Ln
- 441 SW Laura Ln
- 512 SW Hillside Dr
- 2709 NE Crestview St
- 2713 NE Crestview St
- 504 SW Hillside Dr
- 507 SW Hillside Dr
- 510 SW Hillside Dr
- 503 SW Hillside Dr
- 502 SW Hillside Dr
- 508 SW Hillside Dr
- 444 SW Laura Ln
- 430 SW Laura Ln