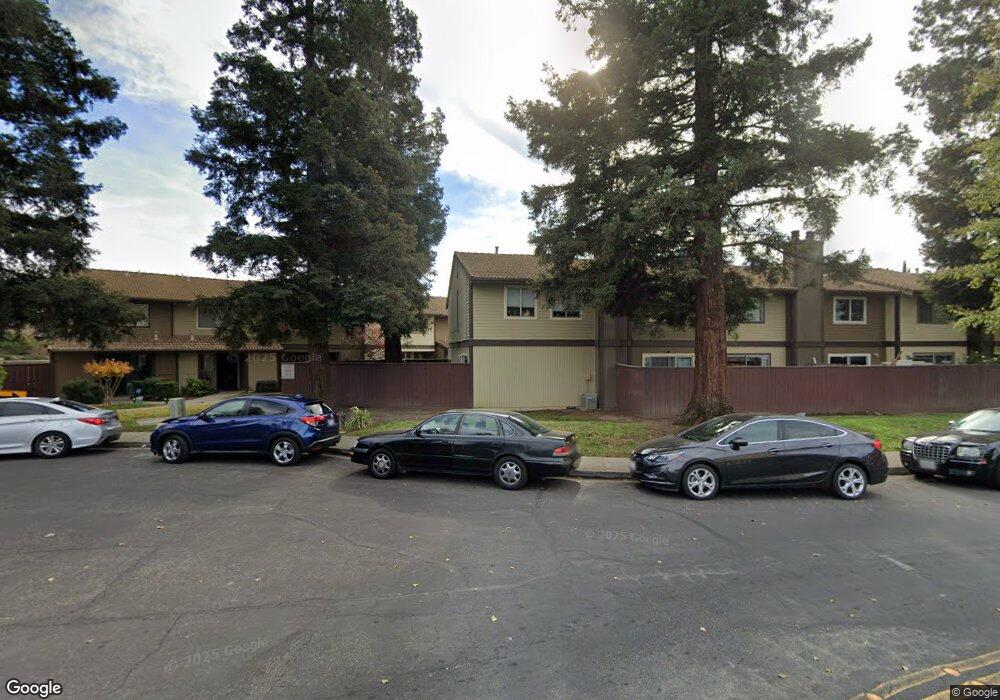
435 Tabor Ave Fairfield, CA 94533
Estimated Value: $354,677 - $390,000
3
Beds
3
Baths
1,269
Sq Ft
$293/Sq Ft
Est. Value
About This Home
This home is located at 435 Tabor Ave, Fairfield, CA 94533 and is currently estimated at $372,169, approximately $293 per square foot. 435 Tabor Ave is a home located in Solano County with nearby schools including David Weir Preparatory Academy, Grange Middle School, and Fairfield High School.
Ownership History
Date
Name
Owned For
Owner Type
Purchase Details
Closed on
Jul 3, 2013
Sold by
Carter Audrey M
Bought by
Xie Yinghua and Ma Rongxin
Current Estimated Value
Purchase Details
Closed on
Sep 22, 2006
Sold by
Pp Fairfield Llc
Bought by
Carter Audrey M
Home Financials for this Owner
Home Financials are based on the most recent Mortgage that was taken out on this home.
Original Mortgage
$11,100
Interest Rate
6.46%
Mortgage Type
Stand Alone Second
Create a Home Valuation Report for This Property
The Home Valuation Report is an in-depth analysis detailing your home's value as well as a comparison with similar homes in the area
Home Values in the Area
Average Home Value in this Area
Purchase History
| Date | Buyer | Sale Price | Title Company |
|---|---|---|---|
| Xie Yinghua | $69,500 | Chicago Title Company | |
| Carter Audrey M | $370,000 | Chicago Title Co |
Source: Public Records
Mortgage History
| Date | Status | Borrower | Loan Amount |
|---|---|---|---|
| Previous Owner | Carter Audrey M | $11,100 | |
| Previous Owner | Carter Audrey M | $370,000 |
Source: Public Records
Tax History
| Year | Tax Paid | Tax Assessment Tax Assessment Total Assessment is a certain percentage of the fair market value that is determined by local assessors to be the total taxable value of land and additions on the property. | Land | Improvement |
|---|---|---|---|---|
| 2025 | $1,557 | $137,286 | $36,769 | $100,517 |
| 2024 | $1,557 | $134,596 | $36,049 | $98,547 |
| 2023 | $1,509 | $131,958 | $35,343 | $96,615 |
| 2022 | $1,491 | $129,371 | $34,651 | $94,720 |
| 2021 | $1,477 | $126,835 | $33,972 | $92,863 |
| 2020 | $1,443 | $125,535 | $33,624 | $91,911 |
| 2019 | $1,408 | $123,074 | $32,965 | $90,109 |
| 2018 | $1,452 | $120,662 | $32,319 | $88,343 |
| 2017 | $1,386 | $118,297 | $31,686 | $86,611 |
| 2016 | $1,368 | $115,978 | $31,065 | $84,913 |
| 2015 | $1,278 | $114,237 | $30,599 | $83,638 |
| 2014 | $1,267 | $112,000 | $30,000 | $82,000 |
Source: Public Records
Map
Nearby Homes
- 1831 Clay St
- 519 Pacific Ave
- 1724 Fillmore St
- 751 Hillcrest Ct
- 1712 Arthur Ct
- 74 Anza Ct
- 219 Wisconsin St
- 1812 San Jose Place
- 1667 Vicksburg Dr
- 1669 Rutledge Ln
- 50 Anza Ct
- 1845 San Anselmo St
- 831 Heath Ct
- 2256 Dorset Ln
- 46 Anza Ct
- 1660 Glenmore Dr
- 1652 Glenmore Dr
- 937 Pacific Ave
- 2292 Rutland Ct
- 2034 Cambridge Dr
Your Personal Tour Guide
Ask me questions while you tour the home.