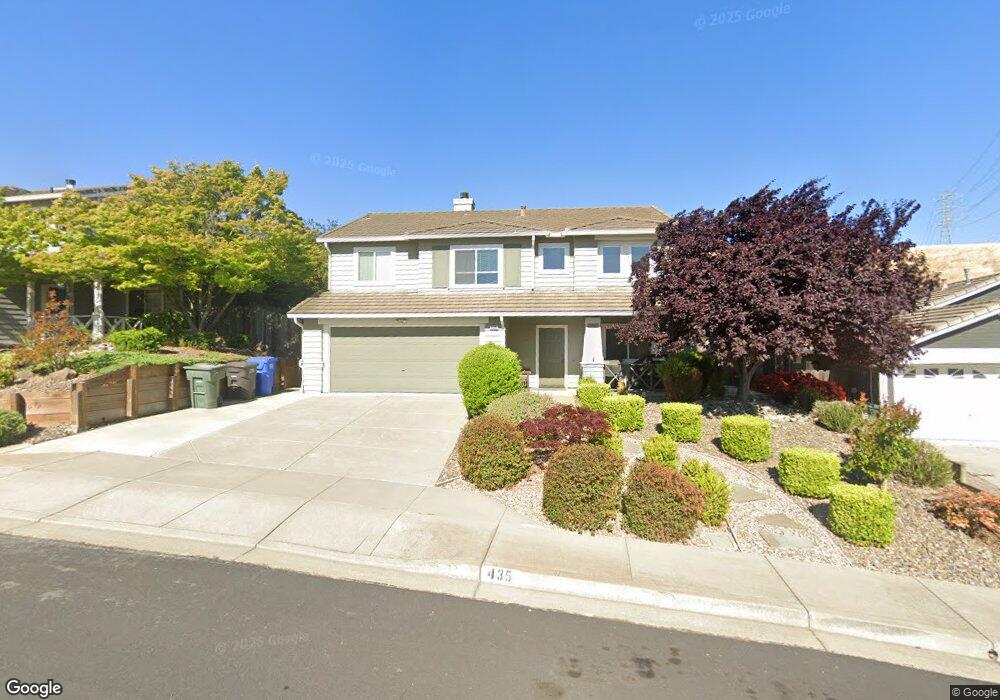
435 Tradewinds Ct Bay Point, CA 94565
Estimated Value: $679,000 - $854,000
4
Beds
3
Baths
2,017
Sq Ft
$370/Sq Ft
Est. Value
About This Home
This home is located at 435 Tradewinds Ct, Bay Point, CA 94565 and is currently estimated at $746,988, approximately $370 per square foot. 435 Tradewinds Ct is a home located in Contra Costa County with nearby schools including Shore Acres Elementary School, Riverview Middle School, and Mt. Diablo High School.
Ownership History
Date
Name
Owned For
Owner Type
Purchase Details
Closed on
Feb 25, 2021
Sold by
Theunissen Michel and Theunissen Lisa
Bought by
Theunissen Michel and Theunissen Lisa
Current Estimated Value
Purchase Details
Closed on
May 18, 2004
Sold by
Scott William A and Scott Victoria L
Bought by
Theunissen Michel and Theunissen Lisa L
Home Financials for this Owner
Home Financials are based on the most recent Mortgage that was taken out on this home.
Original Mortgage
$368,000
Outstanding Balance
$164,862
Interest Rate
4.87%
Mortgage Type
Purchase Money Mortgage
Estimated Equity
$582,126
Purchase Details
Closed on
Mar 23, 1998
Sold by
Kaufman & Broad Of Northern Ca Inc
Bought by
Scott William A and Scott Victoria L
Home Financials for this Owner
Home Financials are based on the most recent Mortgage that was taken out on this home.
Original Mortgage
$179,650
Interest Rate
7.02%
Mortgage Type
Purchase Money Mortgage
Create a Home Valuation Report for This Property
The Home Valuation Report is an in-depth analysis detailing your home's value as well as a comparison with similar homes in the area
Home Values in the Area
Average Home Value in this Area
Purchase History
| Date | Buyer | Sale Price | Title Company |
|---|---|---|---|
| Theunissen Michel | -- | None Available | |
| Theunissen Michel | $460,000 | Commonwealth Title | |
| Scott William A | $200,000 | First American Title Guarant |
Source: Public Records
Mortgage History
| Date | Status | Borrower | Loan Amount |
|---|---|---|---|
| Open | Theunissen Michel | $368,000 | |
| Previous Owner | Scott William A | $179,650 | |
| Closed | Theunissen Michel | $46,000 |
Source: Public Records
Tax History
| Year | Tax Paid | Tax Assessment Tax Assessment Total Assessment is a certain percentage of the fair market value that is determined by local assessors to be the total taxable value of land and additions on the property. | Land | Improvement |
|---|---|---|---|---|
| 2025 | $9,224 | $665,162 | $199,041 | $466,121 |
| 2024 | $8,827 | $652,121 | $195,139 | $456,982 |
| 2023 | $8,827 | $639,335 | $191,313 | $448,022 |
| 2022 | $8,740 | $626,800 | $187,562 | $439,238 |
| 2021 | $7,863 | $555,000 | $180,000 | $375,000 |
| 2019 | $7,609 | $532,000 | $159,195 | $372,805 |
| 2018 | $7,130 | $501,500 | $152,628 | $348,872 |
| 2017 | $6,872 | $487,500 | $148,367 | $339,133 |
| 2016 | $6,237 | $436,000 | $132,694 | $303,306 |
| 2015 | $5,858 | $400,500 | $121,890 | $278,610 |
| 2014 | $5,598 | $377,000 | $114,738 | $262,262 |
Source: Public Records
Map
Nearby Homes
- 469 Powell Dr
- 558 Fletcher St
- 323 Rosemarie Place
- 130 Savona Way
- 2525 Modena Dr
- 621 Bounty Dr
- 1205 Villa Terrace Dr
- 50 Driftwood Cir
- 29 Sandview Dr
- 26 Seaview Dr
- 97 Harbor Dr
- 39 Harbor Dr
- 3777 Willow Pass Rd Unit 85
- 3777 Willow Pass Rd Unit 20
- 2300 Verona Dr
- 93 Beach Dr
- 215 San Bernardino Ct
- 39 Canal Dr
- 92 Beach Dr
- 87 Bay Dr
- 439 Tradewinds Ct
- 431 Tradewinds Ct
- 443 Tradewinds Ct
- 434 Tradewinds Ct
- 438 Tradewinds Ct
- 447 Tradewinds Ct
- 442 Tradewinds Ct
- 451 Tradewinds Ct
- 446 Tradewinds Ct
- 455 Tradewinds Ct
- 450 Tradewinds Ct
- 415 Tradewinds Ct
- 418 Tradewinds Ct
- 412 Tradewinds Ct
- 405 Tradewinds Ct
- 511 Coastview Ct
- 406 Tradewinds Ct
- 515 Coastview Ct
- 400 Tradewinds Ct
- 510 Coastview Ct
Your Personal Tour Guide
Ask me questions while you tour the home.