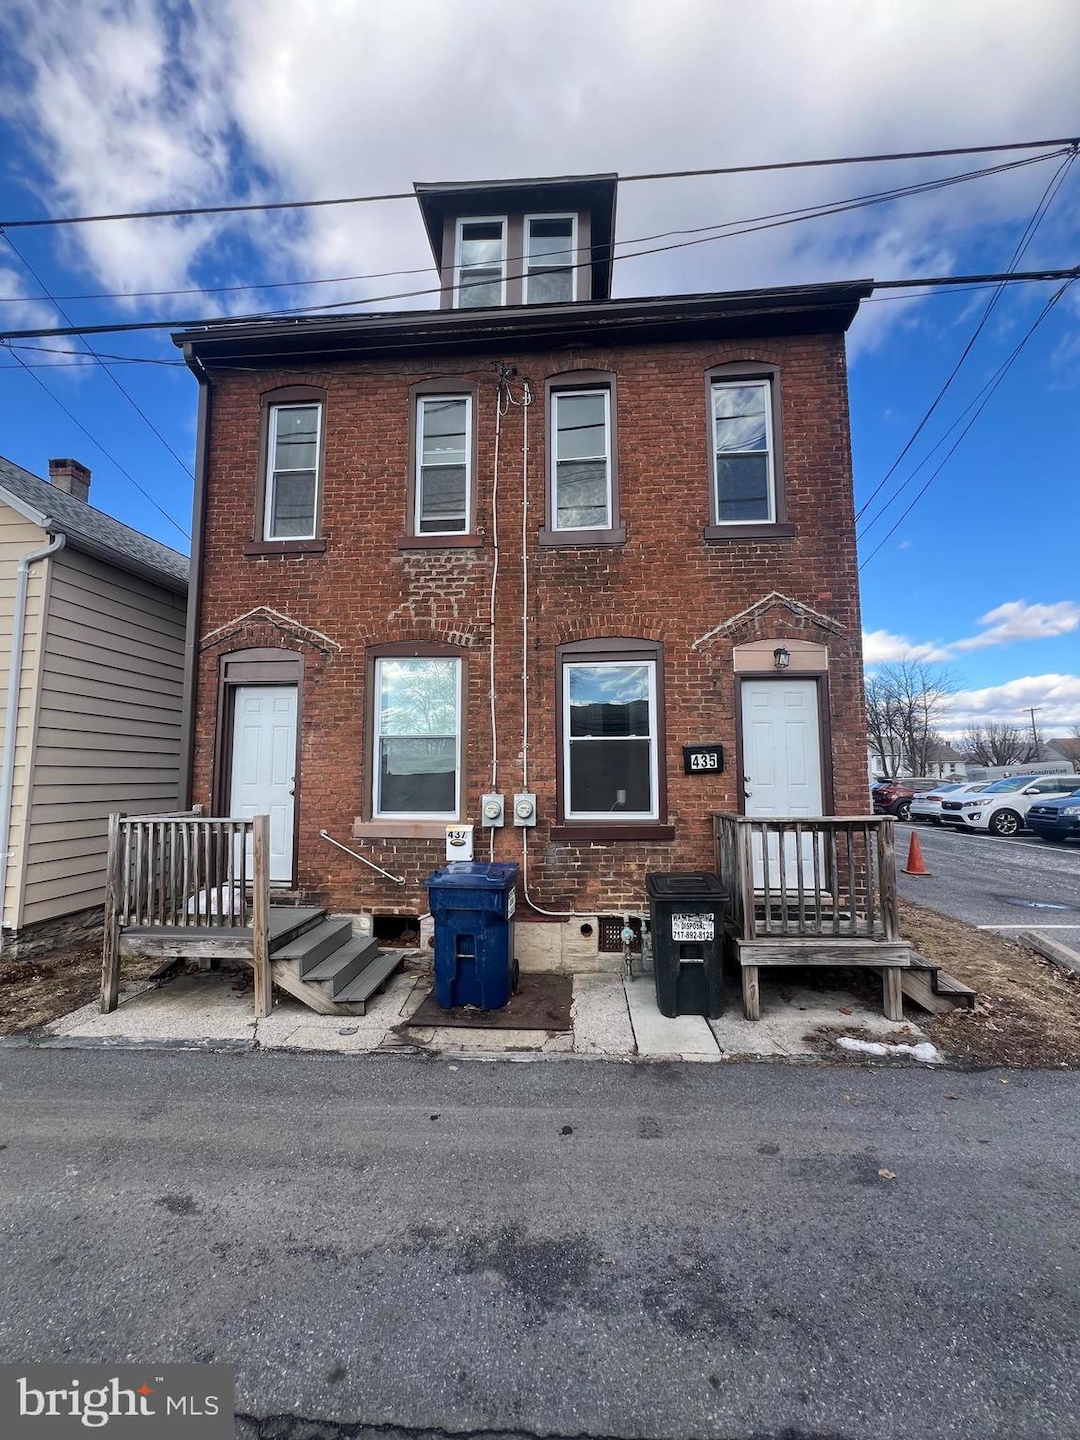
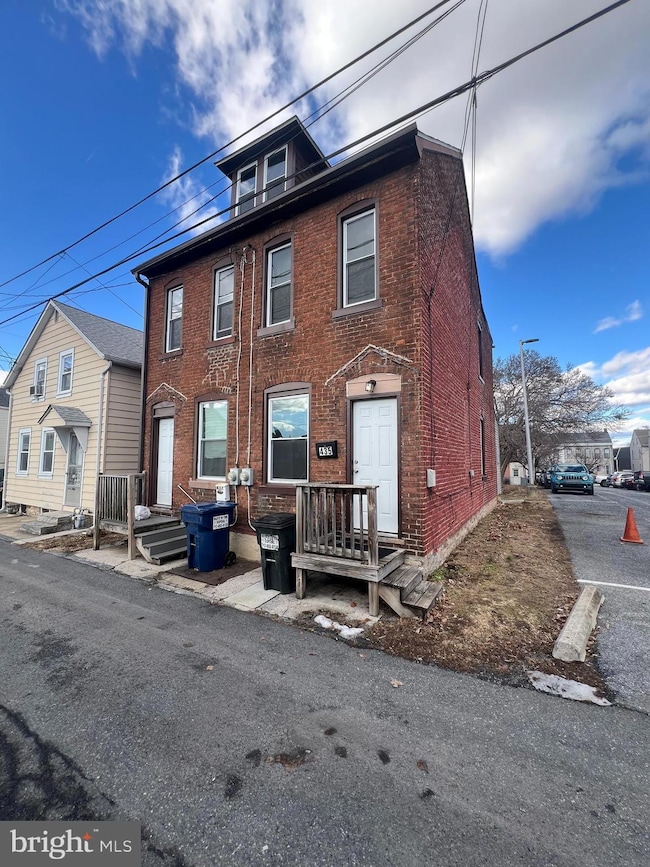
435 Union St Lebanon, PA 17042
About This Home
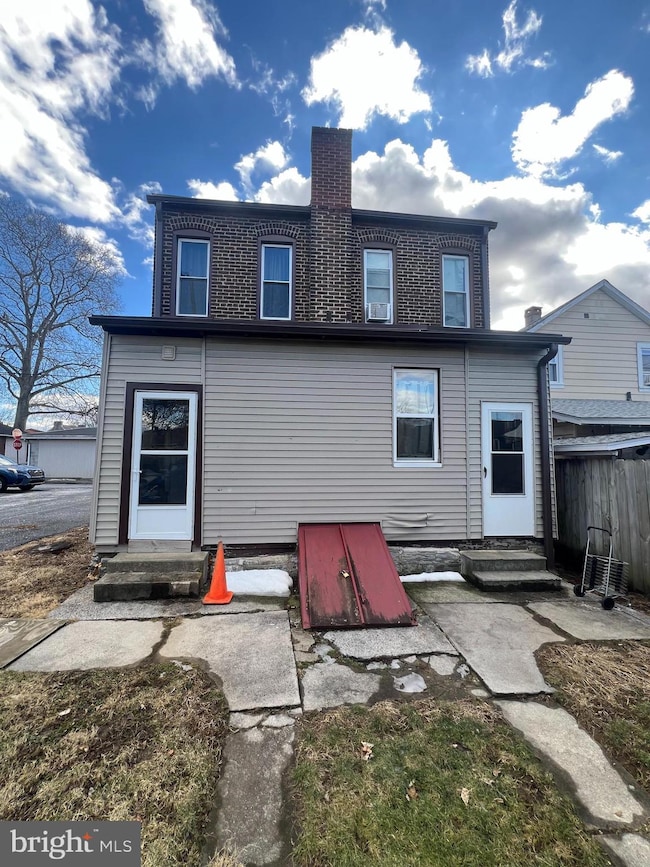
As of February 2025Investors, take note! This well-maintained duplex is a fantastic opportunity with strong rental income. Both 2 bed, 1 bath units have separate utilities and are currently rented at $900/month on month-to-month leases. One side is Section 8 approved at $1,200/month, offering potential for increased earnings. Recent updates include a new roof (2017), replaced windows, and new gutters. Whether you're looking to add to your portfolio or house-hack, this property is a solid choice. Schedule your showing today!

Property Details
Home Type
- Multi-Family
Est. Annual Taxes
- $2,193
Year Built
- Built in 1942
Parking
- On-Street Parking
Home Design
- 1,512 Sq Ft Home
- Duplex
- Side-by-Side
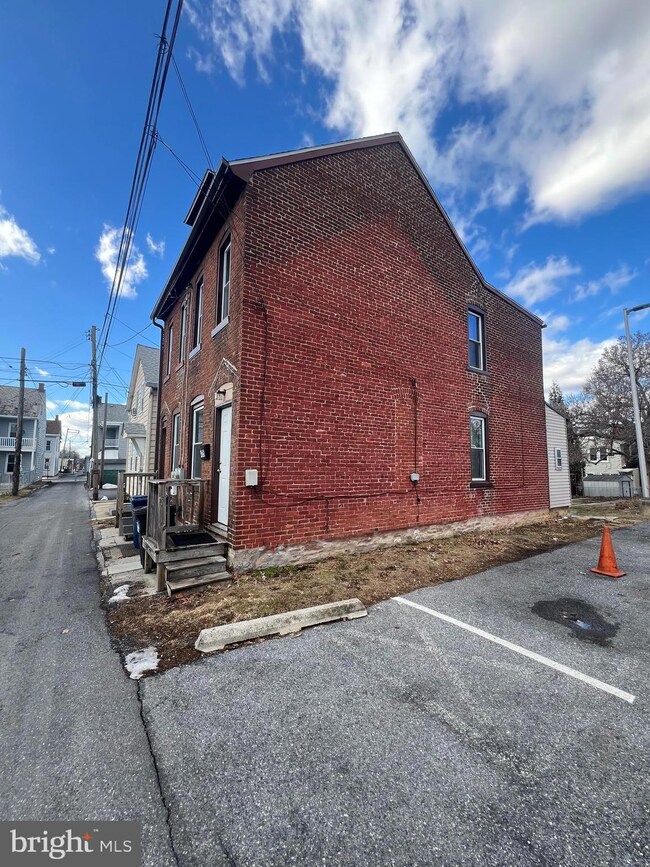
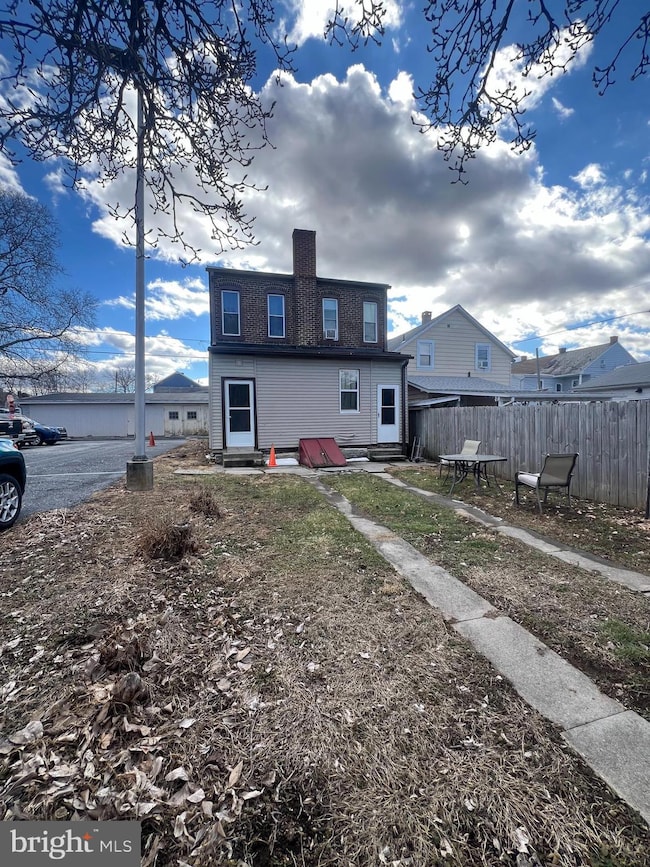
- Brick Exterior Construction
- Stone Foundation
Utilities
- Window Unit Cooling System
- Hot Water Heating System
- 100 Amp Service
- Natural Gas Water Heater
Additional Features
- More Than Two Accessible Exits
- 2,614 Sq Ft Lot
Community Details
- 2 Units
Listing and Financial Details
- The owner pays for trash collection
- Assessor Parcel Number 01-2339677-368235-0000
Ownership History
Purchase Details
Home Financials for this Owner
Home Financials are based on the most recent Mortgage that was taken out on this home.Purchase Details
Home Financials for this Owner
Home Financials are based on the most recent Mortgage that was taken out on this home.Map
Home Values in the Area
Average Home Value in this Area
Purchase History
| Date | Type | Sale Price | Title Company |
|---|---|---|---|
| Deed | $201,500 | None Listed On Document | |
| Deed | $54,000 | None Available |
Mortgage History
| Date | Status | Loan Amount | Loan Type |
|---|---|---|---|
| Previous Owner | $426,640 | New Conventional | |
| Previous Owner | $474,400 | Credit Line Revolving |
Property History
| Date | Event | Price | Change | Sq Ft Price |
|---|---|---|---|---|
| 02/26/2025 02/26/25 | Sold | $200,500 | +8.4% | $133 / Sq Ft |
| 02/07/2025 02/07/25 | Pending | -- | -- | -- |
| 02/06/2025 02/06/25 | For Sale | $185,000 | +242.6% | $122 / Sq Ft |
| 05/17/2017 05/17/17 | Sold | $54,000 | -22.7% | $71 / Sq Ft |
| 04/20/2017 04/20/17 | Pending | -- | -- | -- |
| 10/25/2016 10/25/16 | For Sale | $69,900 | -- | $92 / Sq Ft |
Tax History
| Year | Tax Paid | Tax Assessment Tax Assessment Total Assessment is a certain percentage of the fair market value that is determined by local assessors to be the total taxable value of land and additions on the property. | Land | Improvement |
|---|---|---|---|---|
| 2025 | $2,194 | $68,100 | $8,800 | $59,300 |
| 2024 | $2,090 | $68,100 | $8,800 | $59,300 |
| 2023 | $2,090 | $68,100 | $8,800 | $59,300 |
| 2022 | $2,056 | $68,100 | $8,800 | $59,300 |
| 2021 | $1,986 | $68,100 | $8,800 | $59,300 |
| 2020 | $1,986 | $68,100 | $8,800 | $59,300 |
| 2019 | $1,957 | $68,100 | $8,800 | $59,300 |
| 2018 | $1,901 | $68,100 | $8,800 | $59,300 |
| 2017 | $536 | $68,100 | $8,800 | $59,300 |
| 2016 | $1,851 | $68,100 | $8,800 | $59,300 |
| 2015 | $1,271 | $68,100 | $8,800 | $59,300 |
| 2014 | $1,271 | $68,100 | $8,800 | $59,300 |
Source: Bright MLS
MLS Number: PALN2018600
APN: 01-2339677-368235-0000
Disclaimer: Certain information contained herein is derived from information provided by parties other than Homes.com. All information provided is deemed reliable, but is not guaranteed to be accurate and should be independently verified.
![]() The data relating to real estate for sale on this website appears in part through the BRIGHT Internet Data Exchange program, a voluntary cooperative exchange of property listing data between licensed real estate brokerage firms, and is provided by BRIGHT through a licensing agreement.
The data relating to real estate for sale on this website appears in part through the BRIGHT Internet Data Exchange program, a voluntary cooperative exchange of property listing data between licensed real estate brokerage firms, and is provided by BRIGHT through a licensing agreement.
Listing information is from various brokers who participate in the Bright MLS IDX program and not all listings may be visible on the site.
The property information being provided on or through the website is for the personal, non-commercial use of consumers and such information may not be used for any purpose other than to identify prospective properties consumers may be interested in purchasing.
Some properties which appear for sale on the website may no longer be available because they are for instance, under contract, sold or are no longer being offered for sale.
Property information displayed is deemed reliable but is not guaranteed.
Copyright 2025 Bright MLS, Inc.