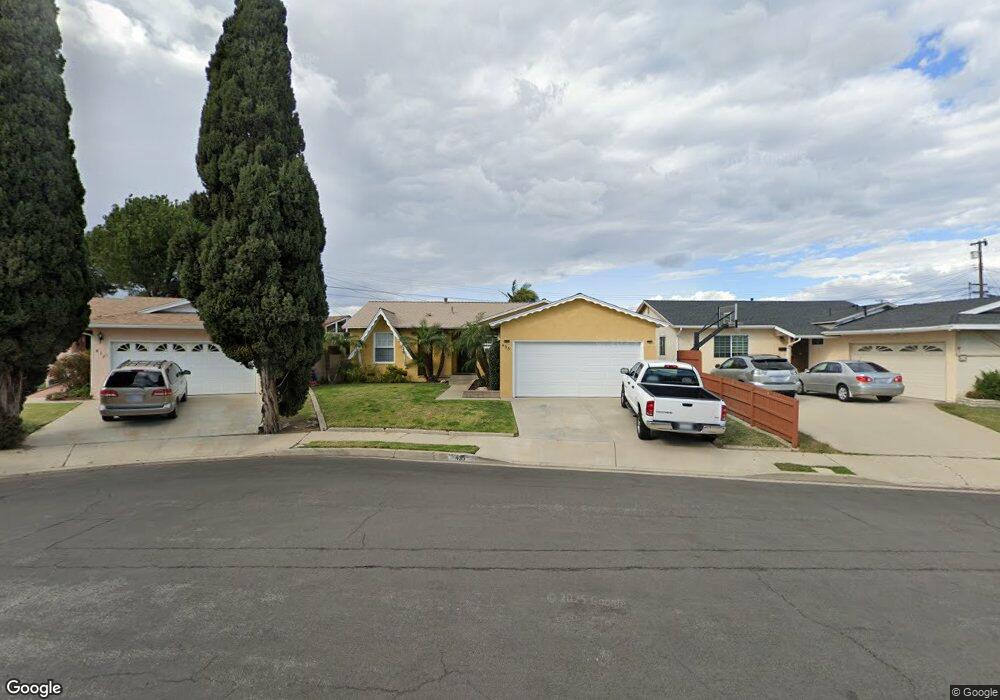
435 W 230th St Carson, CA 90745
Estimated Value: $733,000 - $799,000
3
Beds
2
Baths
1,285
Sq Ft
$597/Sq Ft
Est. Value
About This Home
This home is located at 435 W 230th St, Carson, CA 90745 and is currently estimated at $766,756, approximately $596 per square foot. 435 W 230th St is a home located in Los Angeles County with nearby schools including 232nd Place School, Stephen M. White Middle School, and Academies Of Education And Empowerment.
Ownership History
Date
Name
Owned For
Owner Type
Purchase Details
Closed on
Oct 7, 2004
Sold by
Thomas Bobbie and Banach Kelly
Bought by
Tabera Joe
Current Estimated Value
Home Financials for this Owner
Home Financials are based on the most recent Mortgage that was taken out on this home.
Original Mortgage
$332,000
Interest Rate
5%
Mortgage Type
Purchase Money Mortgage
Purchase Details
Closed on
May 30, 1996
Sold by
Thomas Bobbie E
Bought by
Jones Thomas Lanaya Lee
Home Financials for this Owner
Home Financials are based on the most recent Mortgage that was taken out on this home.
Original Mortgage
$50,000
Interest Rate
7.97%
Create a Home Valuation Report for This Property
The Home Valuation Report is an in-depth analysis detailing your home's value as well as a comparison with similar homes in the area
Home Values in the Area
Average Home Value in this Area
Purchase History
| Date | Buyer | Sale Price | Title Company |
|---|---|---|---|
| Tabera Joe | $415,000 | Provident Title Company | |
| Jones Thomas Lanaya Lee | -- | First American Title Ins Co |
Source: Public Records
Mortgage History
| Date | Status | Borrower | Loan Amount |
|---|---|---|---|
| Previous Owner | Tabera Joe | $332,000 | |
| Previous Owner | Jones Thomas Lanaya Lee | $50,000 | |
| Closed | Tabera Joe | $83,000 |
Source: Public Records
Tax History
| Year | Tax Paid | Tax Assessment Tax Assessment Total Assessment is a certain percentage of the fair market value that is determined by local assessors to be the total taxable value of land and additions on the property. | Land | Improvement |
|---|---|---|---|---|
| 2025 | $7,660 | $578,452 | $430,431 | $148,021 |
| 2024 | $7,660 | $567,111 | $421,992 | $145,119 |
| 2023 | $7,512 | $555,992 | $413,718 | $142,274 |
| 2022 | $7,140 | $545,091 | $405,606 | $139,485 |
| 2021 | $7,057 | $534,403 | $397,653 | $136,750 |
| 2019 | $6,807 | $518,554 | $385,859 | $132,695 |
| 2018 | $6,693 | $508,388 | $378,294 | $130,094 |
| 2016 | $5,881 | $443,000 | $329,000 | $114,000 |
| 2015 | $5,495 | $413,000 | $307,000 | $106,000 |
| 2014 | $5,248 | $385,000 | $286,400 | $98,600 |
Source: Public Records
Map
Nearby Homes
- 22832 Menlo Ave
- 802 W 229th St
- 803 W 228th St Unit 1
- 22906 S Vermont Ave
- 23020 S Vermont Ave
- 803 W 232nd St Unit C
- 23200 Sesame St Unit D
- 23204 Sesame St Unit C
- 820 W 232nd St
- 939 Belson St
- 434 W 223rd St
- 23314 S Vermont Ave
- 405 W 235th St
- 802 Coriander Dr Unit B
- 23304 Sesame St Unit 16R
- 23334 Sesame St Unit E
- 722 W 223rd St Unit 2
- 413 W 223rd St
- 806 Coriander Dr Unit C
- 826 Coriander Dr Unit D
Your Personal Tour Guide
Ask me questions while you tour the home.