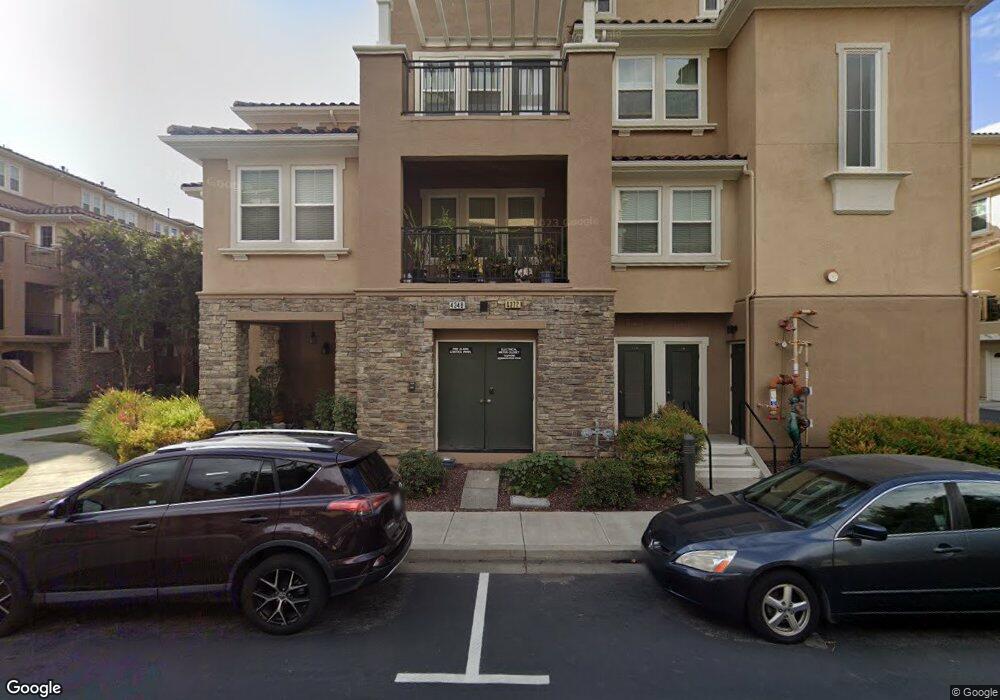
4350 Fitzwilliam St Dublin, CA 94568
Dublin Ranch NeighborhoodEstimated Value: $848,000 - $968,000
3
Beds
3
Baths
2,025
Sq Ft
$444/Sq Ft
Est. Value
About This Home
This home is located at 4350 Fitzwilliam St, Dublin, CA 94568 and is currently estimated at $899,039, approximately $443 per square foot. 4350 Fitzwilliam St is a home located in Alameda County with nearby schools including Harold William Kolb, Dublin High School, and SPRINGFIELD MONTESSORI SCHOOL.
Ownership History
Date
Name
Owned For
Owner Type
Purchase Details
Closed on
Dec 19, 2008
Sold by
Gmac Mortgage Llc
Bought by
Siu Erik and Siu Lauretta W
Current Estimated Value
Home Financials for this Owner
Home Financials are based on the most recent Mortgage that was taken out on this home.
Original Mortgage
$414,529
Outstanding Balance
$273,497
Interest Rate
6.1%
Mortgage Type
FHA
Estimated Equity
$625,542
Purchase Details
Closed on
Dec 7, 2007
Sold by
Him Chantha S
Bought by
Gmac Mortgage Llc
Purchase Details
Closed on
May 16, 2005
Sold by
Toll Dublin Llc
Bought by
Him Chantha S
Home Financials for this Owner
Home Financials are based on the most recent Mortgage that was taken out on this home.
Original Mortgage
$478,034
Interest Rate
6.37%
Mortgage Type
Fannie Mae Freddie Mac
Create a Home Valuation Report for This Property
The Home Valuation Report is an in-depth analysis detailing your home's value as well as a comparison with similar homes in the area
Home Values in the Area
Average Home Value in this Area
Purchase History
| Date | Buyer | Sale Price | Title Company |
|---|---|---|---|
| Siu Erik | $420,000 | First American Title Company | |
| Gmac Mortgage Llc | $520,865 | First American Title Company | |
| Him Chantha S | $598,000 | Chicago Title Co |
Source: Public Records
Mortgage History
| Date | Status | Borrower | Loan Amount |
|---|---|---|---|
| Open | Siu Erik | $414,529 | |
| Previous Owner | Him Chantha S | $478,034 |
Source: Public Records
Tax History
| Year | Tax Paid | Tax Assessment Tax Assessment Total Assessment is a certain percentage of the fair market value that is determined by local assessors to be the total taxable value of land and additions on the property. | Land | Improvement |
|---|---|---|---|---|
| 2025 | $7,721 | $540,820 | $162,246 | $378,574 |
| 2024 | $7,721 | $530,220 | $159,066 | $371,154 |
| 2023 | $7,635 | $519,824 | $155,947 | $363,877 |
| 2022 | $7,505 | $509,635 | $152,890 | $356,745 |
| 2021 | $7,428 | $499,644 | $149,893 | $349,751 |
| 2020 | $6,957 | $494,524 | $148,357 | $346,167 |
| 2019 | $6,913 | $484,830 | $145,449 | $339,381 |
| 2018 | $6,738 | $475,325 | $142,597 | $332,728 |
| 2017 | $6,643 | $466,006 | $139,802 | $326,204 |
| 2016 | $6,068 | $456,871 | $137,061 | $319,810 |
| 2015 | $5,857 | $450,012 | $135,003 | $315,009 |
| 2014 | $5,857 | $441,201 | $132,360 | $308,841 |
Source: Public Records
Map
Nearby Homes
- 3420 Finnian Way Unit 328
- 3360 Maguire Way Unit 201
- 3465 Dublin Blvd Unit 128
- 3465 Dublin Blvd Unit 206
- 3290 Maguire Way Unit 208
- 3290 Maguire Way Unit 101
- 3290 Maguire Way Unit 118
- 3385 Dublin Blvd Unit 308
- 3385 Dublin Blvd Unit 130
- 4302 Keegan St Unit 15
- 3225 Central Pkwy
- 4431 Duccio Place
- 3240 Maguire Way Unit 318
- 3240 Maguire Way Unit 401
- 3275 Dublin Blvd Unit 407
- 3275 Dublin Blvd Unit 412
- 3245 Dublin Blvd Unit 402
- 3489 Capoterra Way
- 3710 Central Pkwy Unit 165
- 3703 Whitworth Dr
- 4348 Fitzwilliam St Unit 173
- 4370 Fitzwilliam St
- 4368 Fitzwilliam St
- 4366 Fitzwilliam St
- 4364 Fitzwilliam St Unit 181
- 4362 Fitzwilliam St Unit 180
- 4360 Fitzwilliam St
- 4358 Fitzwilliam St
- 4356 Fitzwilliam St Unit 177
- 4354 Fitzwilliam St Unit 176
- 4352 Fitzwilliam St
- 4324 Fitzwilliam St
- 4374 Fitzwilliam St Unit 144
- 4376 Fitzwilliam St
- 4378 Fitzwilliam St Unit 142
- 4380 Fitzwilliam St
- 4382 Fitzwilliam St
- 4384 Fitzwilliam St
- 4386 Fitzwilliam St
- 4388 Fitzwilliam St
Your Personal Tour Guide
Ask me questions while you tour the home.