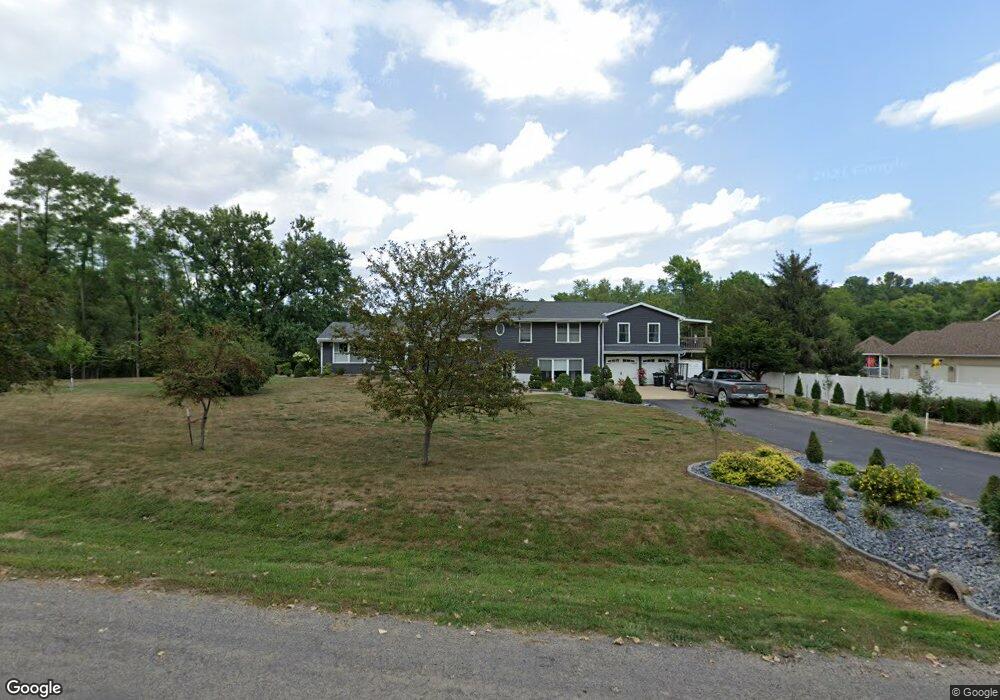
4350 Kenilworth Ct SE Cedar Rapids, IA 52403
Estimated Value: $437,000 - $480,000
4
Beds
4
Baths
3,528
Sq Ft
$131/Sq Ft
Est. Value
About This Home
This home is located at 4350 Kenilworth Ct SE, Cedar Rapids, IA 52403 and is currently estimated at $460,447, approximately $130 per square foot. 4350 Kenilworth Ct SE is a home located in Linn County with nearby schools including Summit Elementary School, Erskine Elementary School, and McKinley STEAM Academy.
Ownership History
Date
Name
Owned For
Owner Type
Purchase Details
Closed on
Aug 12, 2011
Sold by
Clark Marcus R and Clark Edwin John
Bought by
Gudenkauf Roger J and Gudenkauf Tina R
Current Estimated Value
Home Financials for this Owner
Home Financials are based on the most recent Mortgage that was taken out on this home.
Original Mortgage
$207,960
Outstanding Balance
$17,155
Interest Rate
4.54%
Mortgage Type
New Conventional
Estimated Equity
$443,292
Purchase Details
Closed on
Nov 17, 2005
Sold by
Clark E John and Clark Lowell K
Bought by
Clark Marcus R
Home Financials for this Owner
Home Financials are based on the most recent Mortgage that was taken out on this home.
Original Mortgage
$217,600
Interest Rate
6.4%
Mortgage Type
Fannie Mae Freddie Mac
Create a Home Valuation Report for This Property
The Home Valuation Report is an in-depth analysis detailing your home's value as well as a comparison with similar homes in the area
Home Values in the Area
Average Home Value in this Area
Purchase History
| Date | Buyer | Sale Price | Title Company |
|---|---|---|---|
| Gudenkauf Roger J | $259,500 | None Available | |
| Clark Marcus R | $271,500 | None Available |
Source: Public Records
Mortgage History
| Date | Status | Borrower | Loan Amount |
|---|---|---|---|
| Open | Gudenkauf Roger J | $207,960 | |
| Previous Owner | Clark Marcus R | $217,600 |
Source: Public Records
Tax History Compared to Growth
Tax History
| Year | Tax Paid | Tax Assessment Tax Assessment Total Assessment is a certain percentage of the fair market value that is determined by local assessors to be the total taxable value of land and additions on the property. | Land | Improvement |
|---|---|---|---|---|
| 2025 | $4,882 | $462,900 | $81,600 | $381,300 |
| 2024 | $4,822 | $428,700 | $81,600 | $347,100 |
| 2023 | $4,822 | $428,700 | $81,600 | $347,100 |
| 2022 | $4,744 | $350,700 | $81,600 | $269,100 |
| 2021 | $4,860 | $350,700 | $81,600 | $269,100 |
| 2020 | $4,860 | $332,000 | $65,500 | $266,500 |
| 2019 | $4,410 | $308,100 | $65,500 | $242,600 |
| 2018 | $4,144 | $308,100 | $65,500 | $242,600 |
| 2017 | $4,046 | $275,500 | $65,500 | $210,000 |
| 2016 | $4,046 | $275,500 | $65,500 | $210,000 |
| 2015 | $4,008 | $271,600 | $65,500 | $206,100 |
| 2014 | $3,880 | $271,600 | $65,500 | $206,100 |
| 2013 | $3,800 | $271,600 | $65,500 | $206,100 |
Source: Public Records
Map
Nearby Homes
- 4725 Green Valley Dr SE
- 5029 Broadlawn Dr SE
- 3618 Kegler Ct SE
- 380 Indiandale Rd SE
- 3830 Skylark Ln SE
- 2227 Kestrel Dr SE
- 2403 Kestrel Dr SE
- 2416 Kestrel Dr SE
- 2226 Kestrel Dr SE
- 3112 Peregrine Ct SE
- 2306 Kestrel Dr SE
- 2420 Kestrel Dr SE
- 2409 Kestrel Dr SE
- 2421 Kestrel Dr SE
- 2221 Kestrel Dr SE
- 2319 Kestrel Dr SE
- 2415 Kestrel Dr SE
- 2325 Kestrel Dr SE
- 2312 Kestrel Dr SE
- 3100 Peregrine Ct SE
- 4358 Kenilworth Ct SE
- 4353 Kenilworth Ct SE
- 4345 Kenilworth Ct SE
- 225 E Post Rd SE
- 4364 Kenilworth Ct SE
- 223 E Post Rd SE
- 212 E Post Rd SE
- 211 E Post Rd SE
- 4361 Kenilworth Ct SE
- 202 Bever Ln SE
- 216 Bever Ln SE
- 4350 Cottage Grove Pkwy SE
- 208 E Post Rd SE
- 4361 Fox Meadow Dr SE
- 4340 Cottage Grove Pkwy SE
- 230 Bever Ln SE
- 4330 Cottage Grove Pkwy SE
- 263 E Post Rd SE
- 4365 Fox Meadow Dr SE
- 4734 Logan Ln SE