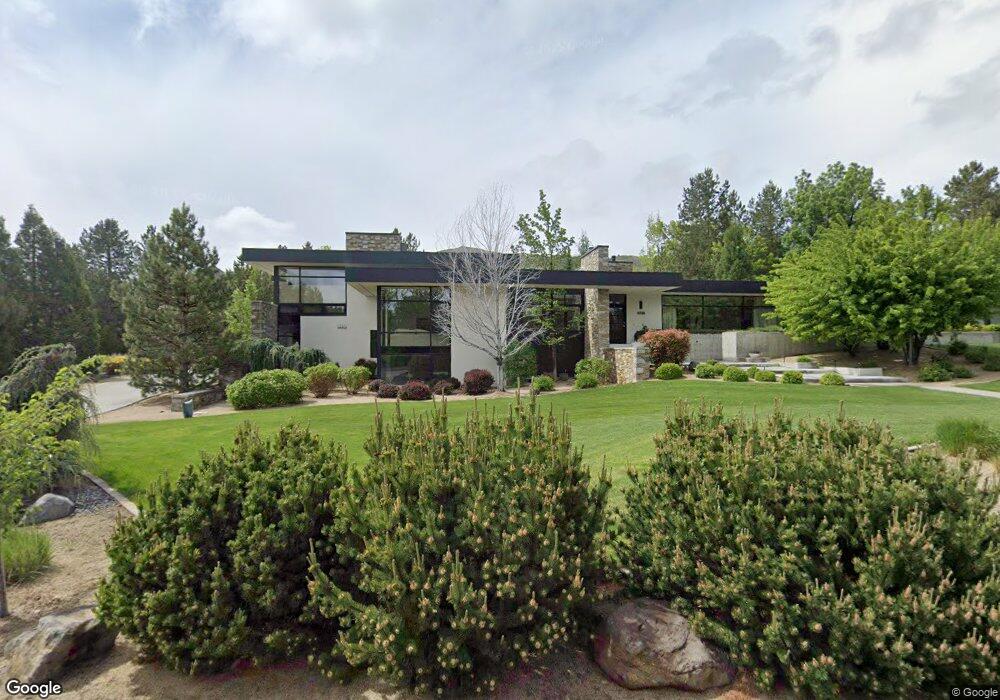
4350 Mountaingate Dr Reno, NV 89519
South Outer Reno NeighborhoodEstimated Value: $1,075,000 - $2,872,000
4
Beds
5
Baths
6,632
Sq Ft
$352/Sq Ft
Est. Value
About This Home
This home is located at 4350 Mountaingate Dr, Reno, NV 89519 and is currently estimated at $2,337,415, approximately $352 per square foot. 4350 Mountaingate Dr is a home located in Washoe County with nearby schools including Roy Gomm Elementary School, Darrell C Swope Middle School, and Reno High School.
Ownership History
Date
Name
Owned For
Owner Type
Purchase Details
Closed on
Jun 27, 2018
Sold by
Murphy Darin and Murphy Tamra
Bought by
Krakora George Alan and Krakora Michelle Cacey
Current Estimated Value
Home Financials for this Owner
Home Financials are based on the most recent Mortgage that was taken out on this home.
Original Mortgage
$1,000,001
Interest Rate
3.75%
Mortgage Type
Adjustable Rate Mortgage/ARM
Purchase Details
Closed on
Jul 11, 2013
Sold by
Murphy Henry F and Murphy Bonnie
Bought by
Murphy Darin and Murphy Tamra
Purchase Details
Closed on
Apr 22, 2010
Sold by
Durkee Danielle Marie
Bought by
Murphy Henry F and Murphy Bonnie
Purchase Details
Closed on
Dec 11, 2000
Sold by
Durkee David Ernest and Durkee Danielle Marie
Bought by
Durkee Danielle Marie
Create a Home Valuation Report for This Property
The Home Valuation Report is an in-depth analysis detailing your home's value as well as a comparison with similar homes in the area
Home Values in the Area
Average Home Value in this Area
Purchase History
| Date | Buyer | Sale Price | Title Company |
|---|---|---|---|
| Krakora George Alan | $2,500,000 | Western Title Co | |
| Murphy Darin | -- | None Available | |
| Murphy Henry F | -- | None Available | |
| Murphy Henry F | $200,000 | Western Title Company | |
| Durkee Danielle Marie | -- | -- |
Source: Public Records
Mortgage History
| Date | Status | Borrower | Loan Amount |
|---|---|---|---|
| Previous Owner | Krakora George Alan | $1,000,001 |
Source: Public Records
Tax History
| Year | Tax Paid | Tax Assessment Tax Assessment Total Assessment is a certain percentage of the fair market value that is determined by local assessors to be the total taxable value of land and additions on the property. | Land | Improvement |
|---|---|---|---|---|
| 2026 | -- | $695,626 | $137,813 | $557,814 |
| 2025 | $13,755 | $681,669 | $117,600 | $564,069 |
| 2024 | $13,755 | $685,929 | $117,600 | $568,329 |
| 2023 | $13,359 | $635,231 | $110,250 | $524,981 |
| 2022 | $12,971 | $547,513 | $97,388 | $450,126 |
| 2021 | $12,599 | $530,086 | $82,688 | $447,398 |
| 2020 | $12,230 | $523,413 | $82,688 | $440,725 |
| 2019 | $11,874 | $518,663 | $73,500 | $445,163 |
| 2018 | $11,327 | $355,791 | $73,500 | $282,291 |
| 2017 | $10,997 | $355,636 | $73,500 | $282,136 |
| 2016 | $10,720 | $353,792 | $67,988 | $285,804 |
| 2015 | $10,701 | $329,535 | $41,197 | $288,338 |
| 2014 | $10,389 | $283,205 | $31,973 | $251,232 |
| 2013 | -- | $259,847 | $31,973 | $227,874 |
Source: Public Records
Map
Nearby Homes
- 0 Woodchuck Cir Unit 41-051-24
- 4930 Woodchuck Cir Unit 4
- 4890 Woodchuck Cir Unit 3
- 4820 Woodchuck Cir Unit 2
- 4895 Woodchuck Cir Unit 16
- 4760 Woodchuck Cir Unit 1
- 4825 Woodchuck Cir Unit 17
- 5045 Hunters Peak Rd Unit 13
- 4840 Keshmiri Place
- 4055 Plateau Rd
- 7440 W 4th St Unit 7
- 7440 W 4th St Unit 73
- 7440 W 4th St Unit 45
- 4260 Longknife Rd
- 20 Promontory Pointe
- 41 Sawbuck Rd
- 4005 Nemaha Creek Ct
- 6850 Sharlands Ave Unit 2039
- 6850 Sharlands Ave Unit L2066
- 8101 Leroy St
- 4350 Mountaingate Dr Unit Dr
- 4370 Mountaingate Dr Unit 1
- 4330 Mountaingate Dr
- 4325 Mountaingate Dr
- 4335 Mountaingate Dr Unit 1
- 4345 Mountaingate Dr Unit 1
- 4355 Mountaingate Dr
- 4259 Plateau Rd
- 4365 Mountaingate Dr
- 4375 Mountaingate Dr
- 4390 Mountaingate Dr
- 4385 Mountaingate Dr
- 4300 Mountaingate Dr
- 4395 Mountaingate Dr
- 4400 Mountaingate Dr
- 4265 Plateau Rd
- 4405 Mountaingate Dr
- 7075 Aspen Trail
- 4255 Plateau Rd
- 4295 Juniper Trail
Your Personal Tour Guide
Ask me questions while you tour the home.