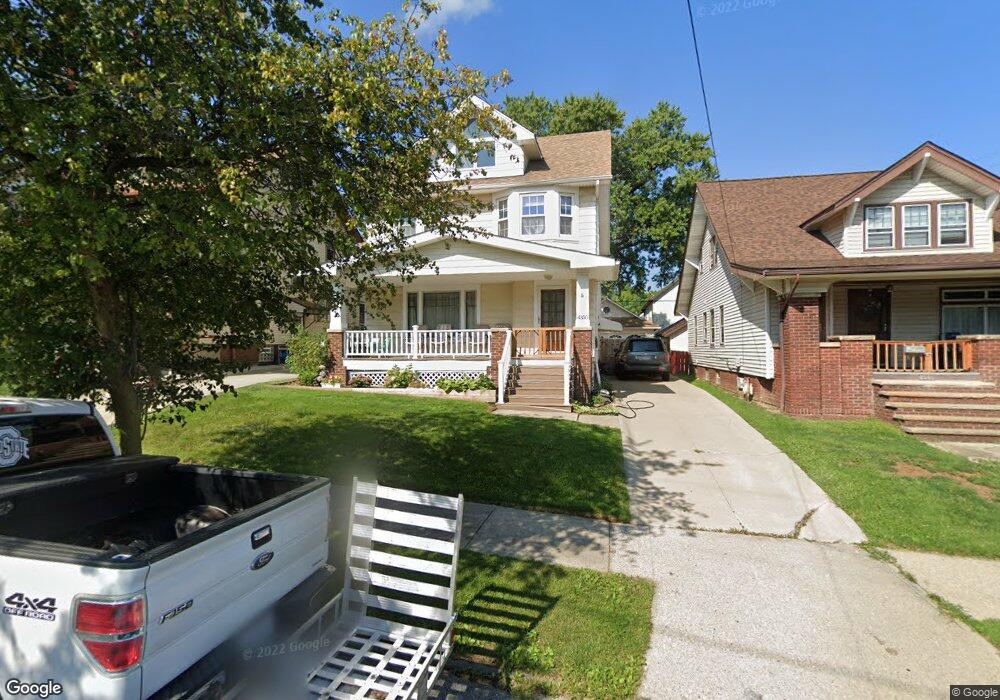
4350 W 48th St Cleveland, OH 44144
Old Brooklyn NeighborhoodEstimated Value: $154,924 - $192,000
3
Beds
2
Baths
1,418
Sq Ft
$127/Sq Ft
Est. Value
About This Home
This home is located at 4350 W 48th St, Cleveland, OH 44144 and is currently estimated at $179,481, approximately $126 per square foot. 4350 W 48th St is a home located in Cuyahoga County with nearby schools including Benjamin Franklin, Almira Academy, and Artemus Ward School.
Ownership History
Date
Name
Owned For
Owner Type
Purchase Details
Closed on
Apr 14, 2021
Sold by
Estate Of Michael T Conroy
Bought by
Conroy Sabina
Current Estimated Value
Purchase Details
Closed on
Nov 8, 2000
Sold by
Conroy Michael T and Conroy Sabrina Margevucius
Bought by
Conroy Michael T and Conroy Sabina
Home Financials for this Owner
Home Financials are based on the most recent Mortgage that was taken out on this home.
Original Mortgage
$80,000
Outstanding Balance
$29,542
Interest Rate
7.91%
Estimated Equity
$149,940
Purchase Details
Closed on
May 4, 1984
Sold by
Folger Laura J
Bought by
Conroy Michael J and Conroy Sabrina M
Purchase Details
Closed on
Aug 29, 1977
Sold by
Salvatore Anthony
Bought by
Folger Laura J
Purchase Details
Closed on
Nov 29, 1976
Sold by
Thomas Omar and Thomas Sondra C
Bought by
Salvatore Anthony
Purchase Details
Closed on
Jan 1, 1975
Bought by
Thomas Omar and Thomas Sondra C
Create a Home Valuation Report for This Property
The Home Valuation Report is an in-depth analysis detailing your home's value as well as a comparison with similar homes in the area
Home Values in the Area
Average Home Value in this Area
Purchase History
| Date | Buyer | Sale Price | Title Company |
|---|---|---|---|
| Conroy Sabina | -- | None Available | |
| Conroy Michael T | -- | -- | |
| Conroy Michael J | $49,000 | -- | |
| Folger Laura J | $36,500 | -- | |
| Salvatore Anthony | $33,000 | -- | |
| Thomas Omar | -- | -- |
Source: Public Records
Mortgage History
| Date | Status | Borrower | Loan Amount |
|---|---|---|---|
| Open | Conroy Michael T | $80,000 |
Source: Public Records
Tax History Compared to Growth
Tax History
| Year | Tax Paid | Tax Assessment Tax Assessment Total Assessment is a certain percentage of the fair market value that is determined by local assessors to be the total taxable value of land and additions on the property. | Land | Improvement |
|---|---|---|---|---|
| 2024 | $3,073 | $46,865 | $8,470 | $38,395 |
| 2023 | $2,549 | $33,600 | $5,740 | $27,860 |
| 2022 | $2,534 | $33,600 | $5,740 | $27,860 |
| 2021 | $2,508 | $33,600 | $5,740 | $27,860 |
| 2020 | $2,250 | $26,040 | $4,450 | $21,600 |
| 2019 | $2,080 | $74,400 | $12,700 | $61,700 |
| 2018 | $2,073 | $26,040 | $4,450 | $21,600 |
| 2017 | $2,078 | $25,200 | $3,780 | $21,420 |
| 2016 | $2,062 | $25,200 | $3,780 | $21,420 |
| 2015 | $3,720 | $25,200 | $3,780 | $21,420 |
| 2014 | $3,720 | $28,000 | $4,200 | $23,800 |
Source: Public Records
Map
Nearby Homes
- 4427 W 49th St
- 4373 W 52nd St
- 4510 Woburn Ave
- 4456 W 49th St
- 4811 Ardmore Ave
- 4615 Ardmore Ave
- 4329 Ardmore Ave
- 4484 W 53rd St
- 4520 Wichita Ave
- 4102 Spokane Ave
- 4185 W 50th St
- 5105 Behrwald Ave
- 5310 Behrwald Ave
- 4002 Ardmore Ave
- 3821 Spokane Ave
- 4140 W 49th St
- 3909 Memphis Ave
- 4215 W 58th St
- 3816 Bucyrus Ave
- 4109 W 50th St