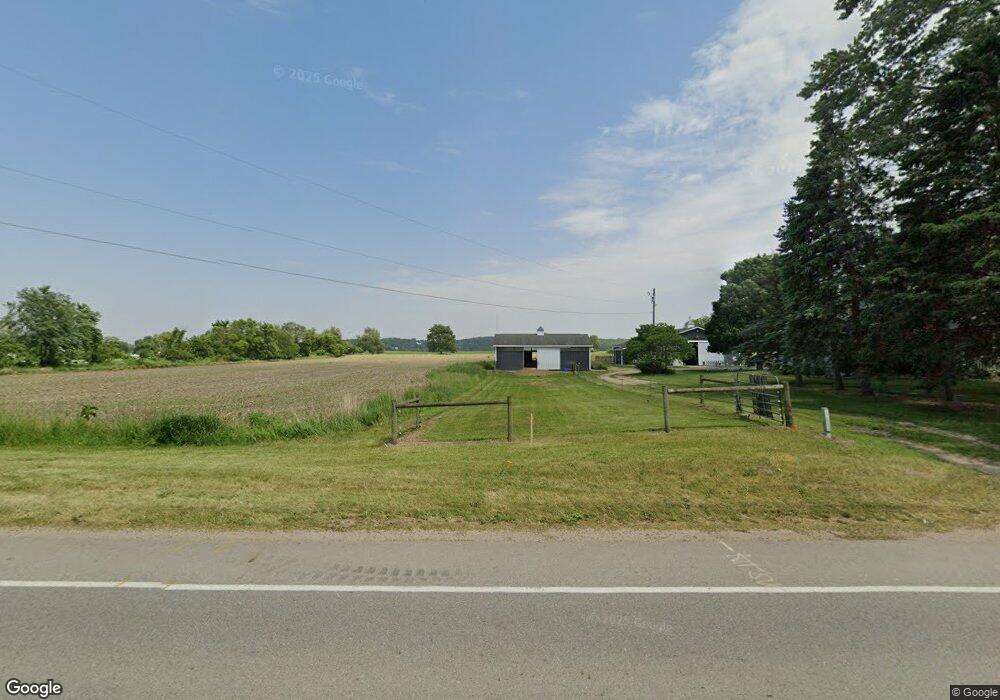
4351 Division St Wayland, MI 49348
Estimated Value: $489,000 - $676,000
3
Beds
3
Baths
2,736
Sq Ft
$215/Sq Ft
Est. Value
About This Home
This home is located at 4351 Division St, Wayland, MI 49348 and is currently estimated at $587,706, approximately $214 per square foot. 4351 Division St is a home located in Allegan County with nearby schools including Wayland High School, Moline Christian School, and St. Therese Catholic School.
Ownership History
Date
Name
Owned For
Owner Type
Purchase Details
Closed on
May 20, 2014
Sold by
Tullar Richard P
Bought by
Tullar Tammy L
Current Estimated Value
Purchase Details
Closed on
Feb 13, 2013
Sold by
Morren & Associates Llc
Bought by
Moline Land Company Llc
Purchase Details
Closed on
Feb 20, 2009
Sold by
Tullar Richard P and Tullar Tammy L
Bought by
Tullar Richard P and Tullar Tammy L
Home Financials for this Owner
Home Financials are based on the most recent Mortgage that was taken out on this home.
Original Mortgage
$99,000
Interest Rate
4.91%
Mortgage Type
New Conventional
Purchase Details
Closed on
Sep 22, 1999
Bought by
Deweerd Tammy and Tullar Richard
Purchase Details
Closed on
May 8, 1998
Sold by
Becker Greta
Bought by
Deweerd Tammy
Create a Home Valuation Report for This Property
The Home Valuation Report is an in-depth analysis detailing your home's value as well as a comparison with similar homes in the area
Home Values in the Area
Average Home Value in this Area
Purchase History
| Date | Buyer | Sale Price | Title Company |
|---|---|---|---|
| Tullar Tammy L | -- | None Available | |
| Moline Land Company Llc | -- | None Available | |
| Tullar Richard P | -- | Stewart Title Guaranty Co | |
| Deweerd Tammy | -- | -- | |
| Deweerd Tammy | -- | -- |
Source: Public Records
Mortgage History
| Date | Status | Borrower | Loan Amount |
|---|---|---|---|
| Previous Owner | Tullar Richard P | $99,000 |
Source: Public Records
Tax History Compared to Growth
Tax History
| Year | Tax Paid | Tax Assessment Tax Assessment Total Assessment is a certain percentage of the fair market value that is determined by local assessors to be the total taxable value of land and additions on the property. | Land | Improvement |
|---|---|---|---|---|
| 2025 | $4,851 | $297,200 | $54,800 | $242,400 |
| 2024 | $4,625 | $287,800 | $44,900 | $242,900 |
| 2023 | $4,625 | $257,200 | $44,900 | $212,300 |
| 2022 | $4,625 | $230,600 | $44,900 | $185,700 |
| 2021 | $4,554 | $214,700 | $45,500 | $169,200 |
| 2020 | $4,660 | $204,200 | $45,500 | $158,700 |
| 2019 | $4,127 | $186,500 | $43,500 | $143,000 |
| 2018 | $4,069 | $171,900 | $43,500 | $128,400 |
| 2017 | $0 | $164,500 | $43,500 | $121,000 |
| 2016 | $0 | $136,900 | $43,500 | $93,400 |
| 2015 | -- | $136,900 | $43,500 | $93,400 |
| 2014 | -- | $128,100 | $42,800 | $85,300 |
| 2013 | $2,719 | $123,000 | $42,800 | $80,200 |
Source: Public Records
Map
Nearby Homes
- 4316 Sussex Place
- 4335 Tavistock Dr
- 4273 Highpoint Dr Unit 112
- Unit 111 Highpoint Dr
- 4274 Butternut Dr
- 4351 Hickory View Ct
- Lot 142 Butternut Dr
- Lot 141 Butternut Dr
- 4249 Butternut Dr
- 4245 Butternut Dr
- 4240 Butternut Dr
- Vienna Plan at Harvest Meadows
- Charlotte Plan at Harvest Meadows
- Sierra Plan at Harvest Meadows
- Karolynn Plan at Harvest Meadows
- Reno Plan at Harvest Meadows
- Bayberry Plan at Harvest Meadows
- Freedom Plan at Harvest Meadows
- London Plan at Harvest Meadows
- Hampton Plan at Harvest Meadows
- 4356 Division St
- 4340 Division St
- 4343 Division St
- 4371 Division St
- 1108 Janice St
- 1104 Janice St
- 1112 Janice St
- 1105 Janice St
- 1116 Janice St
- 1120 Janice St
- 1113 Janice St
- 1111 Janice St
- 1124 Janice St
- 4321 Division St
- 4385 Division St
- 4358 Warwick St
- 4358 Warwick St Unit 268
- 4372 Division St
- 4372 Division Ave S
- 1128 Janice St