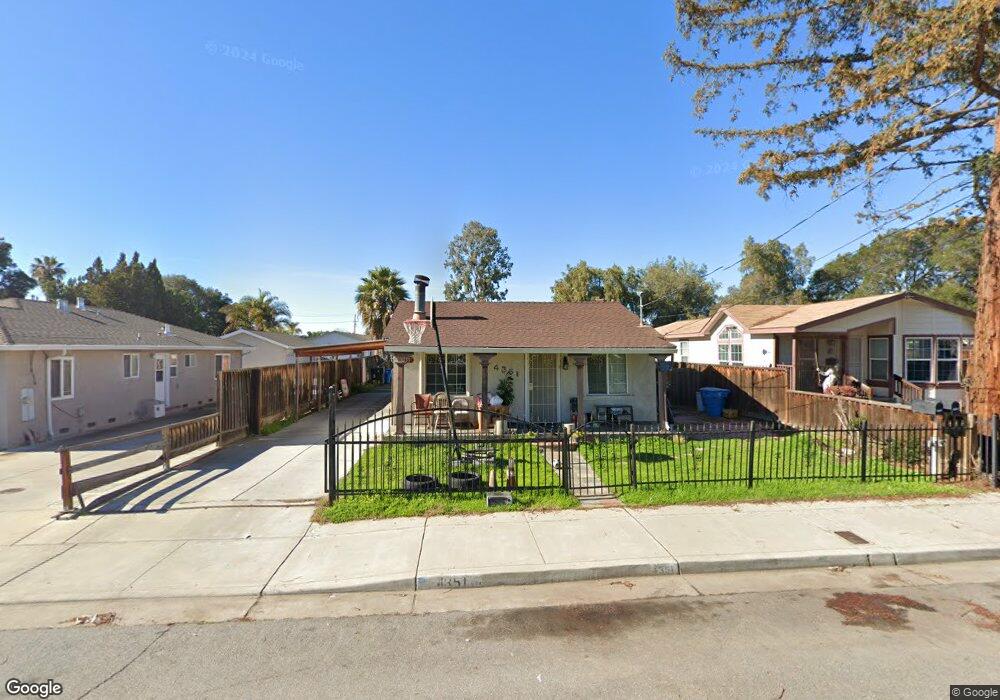
4351 Hyland Ave San Jose, CA 95127
Alum Rock NeighborhoodEstimated Value: $924,005 - $1,008,000
2
Beds
1
Bath
635
Sq Ft
$1,536/Sq Ft
Est. Value
About This Home
This home is located at 4351 Hyland Ave, San Jose, CA 95127 and is currently estimated at $975,251, approximately $1,535 per square foot. 4351 Hyland Ave is a home located in Santa Clara County with nearby schools including Linda Vista Elementary School, Joseph George Middle School, and James Lick High School.
Ownership History
Date
Name
Owned For
Owner Type
Purchase Details
Closed on
Nov 7, 2009
Sold by
Trinh Hoa Q
Bought by
Trinh Hoa Q
Current Estimated Value
Purchase Details
Closed on
Jun 5, 2009
Sold by
Aurora Loan Services Llc
Bought by
Trinh Hoa Q
Purchase Details
Closed on
Feb 10, 2009
Sold by
Zendejas Adolfo
Bought by
Aurora Loan Services Llc
Purchase Details
Closed on
Jun 14, 2006
Sold by
Rivas Theresa
Bought by
Zendejas Adolfo
Home Financials for this Owner
Home Financials are based on the most recent Mortgage that was taken out on this home.
Original Mortgage
$117,000
Interest Rate
6.57%
Mortgage Type
Stand Alone Second
Purchase Details
Closed on
Apr 25, 2002
Sold by
Young David
Bought by
Rivas Theresa
Home Financials for this Owner
Home Financials are based on the most recent Mortgage that was taken out on this home.
Original Mortgage
$285,000
Interest Rate
7.9%
Purchase Details
Closed on
Mar 22, 1999
Sold by
Rivas Theresa and Rivas Theresa M
Bought by
Young David and Rivas Theresa
Home Financials for this Owner
Home Financials are based on the most recent Mortgage that was taken out on this home.
Original Mortgage
$89,359
Interest Rate
6.73%
Create a Home Valuation Report for This Property
The Home Valuation Report is an in-depth analysis detailing your home's value as well as a comparison with similar homes in the area
Home Values in the Area
Average Home Value in this Area
Purchase History
| Date | Buyer | Sale Price | Title Company |
|---|---|---|---|
| Trinh Hoa Q | -- | None Available | |
| Trinh Hoa Q | $219,000 | Lsi Title Agency | |
| Aurora Loan Services Llc | $266,200 | Accommodation | |
| Zendejas Adolfo | $585,000 | Alliance Title Company | |
| Rivas Theresa | -- | Bridgespan Title Company | |
| Young David | -- | Fidelity National Title Ins |
Source: Public Records
Mortgage History
| Date | Status | Borrower | Loan Amount |
|---|---|---|---|
| Previous Owner | Zendejas Adolfo | $117,000 | |
| Previous Owner | Zendejas Adolfo | $468,000 | |
| Previous Owner | Rivas Theresa | $285,000 | |
| Previous Owner | Young David | $89,359 |
Source: Public Records
Tax History Compared to Growth
Tax History
| Year | Tax Paid | Tax Assessment Tax Assessment Total Assessment is a certain percentage of the fair market value that is determined by local assessors to be the total taxable value of land and additions on the property. | Land | Improvement |
|---|---|---|---|---|
| 2025 | $6,489 | $412,685 | $206,033 | $206,652 |
| 2024 | $6,489 | $404,594 | $201,994 | $202,600 |
| 2023 | $6,332 | $396,662 | $198,034 | $198,628 |
| 2022 | $6,151 | $388,885 | $194,151 | $194,734 |
| 2021 | $5,934 | $381,261 | $190,345 | $190,916 |
| 2020 | $5,826 | $377,353 | $188,394 | $188,959 |
| 2019 | $5,690 | $369,954 | $184,700 | $185,254 |
| 2018 | $5,658 | $362,701 | $181,079 | $181,622 |
| 2017 | $5,688 | $355,590 | $177,529 | $178,061 |
| 2016 | $5,388 | $348,619 | $174,049 | $174,570 |
| 2015 | $5,395 | $343,383 | $171,435 | $171,948 |
| 2014 | $5,250 | $336,657 | $168,077 | $168,580 |
Source: Public Records
Map
Nearby Homes
- 160 Talmadge Ave
- 80 Pickford Ave
- 124 Cedar Ln
- 3101 Starburst Ct
- 207 N Claremont Ave
- 75 S Cragmont Ave
- 3014 Florence Ave
- 2925 Florence Ave Unit 17
- 2925 Florence Ave Unit 67
- 2925 Florence Ave Unit 82
- 3405 E Hills Dr
- 58 Clareview Ave
- 292 N Cragmont Ave
- 0 Gordon Blvd Unit 231524
- 0 Gordon Blvd Unit FR25034343
- 0 Gordon Blvd Unit 625465
- 0 Gordon Blvd Unit SR23111317
- 3278 Faith Ct
- 13612 Emilie Dr
- 236 S Claremont Ave
- 4381 Hyland Ave
- 4349 Hyland Ave
- 4391 Hyland Ave
- 4347 Hyland Ave
- 121 Talmadge Ave
- 119 Talmadge Ave
- 109 Talmadge Ave
- 4353 Hyland Ave
- 4335 Hyland Ave
- 4370 Hyland Ave
- 153 Talmadge Ave
- 4360 Hyland Ave
- 4390 Hyland Ave
- 4309 Hyland Ave
- 4323 Hyland Ave
- 157 Talmadge Ave
- 77 Talmadge Ave
- 4344 Hyland Ave
- 71 Talmadge Ave
- 98 Manning Ave