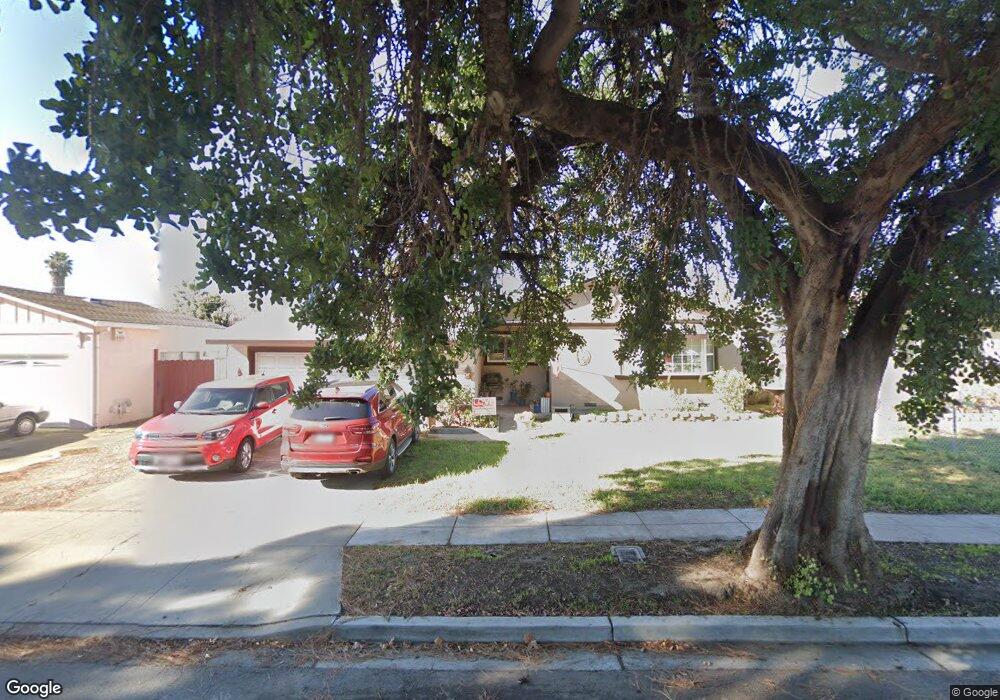
4351 Mowry Ave Fremont, CA 94538
Glenmoor NeighborhoodEstimated Value: $1,281,164 - $1,494,000
3
Beds
2
Baths
1,390
Sq Ft
$990/Sq Ft
Est. Value
About This Home
This home is located at 4351 Mowry Ave, Fremont, CA 94538 and is currently estimated at $1,376,791, approximately $990 per square foot. 4351 Mowry Ave is a home located in Alameda County with nearby schools including Tom Maloney Elementary School, Centerville Junior High School, and Washington High School.
Ownership History
Date
Name
Owned For
Owner Type
Purchase Details
Closed on
Aug 5, 2020
Sold by
Prasad Rawal Jason and Prasad Jason
Bought by
Prasad Rawal Jason and Prasad Shalini
Current Estimated Value
Home Financials for this Owner
Home Financials are based on the most recent Mortgage that was taken out on this home.
Original Mortgage
$490,000
Outstanding Balance
$435,467
Interest Rate
3.1%
Mortgage Type
New Conventional
Estimated Equity
$941,324
Purchase Details
Closed on
Oct 8, 2019
Sold by
Prasad Rawal Jason and Estate Of Rajendra Prasad
Bought by
Prasad Rawal Jason and Prasad Jason
Purchase Details
Closed on
Oct 19, 1993
Sold by
Petersen Kenneteh C and Petersen Jennifer
Bought by
Prasad Rajendra and Prasad Sushila
Home Financials for this Owner
Home Financials are based on the most recent Mortgage that was taken out on this home.
Original Mortgage
$180,500
Interest Rate
4.37%
Create a Home Valuation Report for This Property
The Home Valuation Report is an in-depth analysis detailing your home's value as well as a comparison with similar homes in the area
Home Values in the Area
Average Home Value in this Area
Purchase History
| Date | Buyer | Sale Price | Title Company |
|---|---|---|---|
| Prasad Rawal Jason | -- | Old Republic Title Company | |
| Prasad Rawal Jason | -- | None Available | |
| Prasad Rajendra | $190,000 | Placer Title Company |
Source: Public Records
Mortgage History
| Date | Status | Borrower | Loan Amount |
|---|---|---|---|
| Open | Prasad Rawal Jason | $490,000 | |
| Previous Owner | Prasad Rajendra | $180,500 |
Source: Public Records
Tax History Compared to Growth
Tax History
| Year | Tax Paid | Tax Assessment Tax Assessment Total Assessment is a certain percentage of the fair market value that is determined by local assessors to be the total taxable value of land and additions on the property. | Land | Improvement |
|---|---|---|---|---|
| 2025 | $4,329 | $315,923 | $96,877 | $226,046 |
| 2024 | $4,329 | $309,592 | $94,977 | $221,615 |
| 2023 | $4,198 | $310,385 | $93,115 | $217,270 |
| 2022 | $4,122 | $297,300 | $91,290 | $213,010 |
| 2021 | $4,026 | $291,333 | $89,500 | $208,833 |
| 2020 | $3,970 | $295,274 | $88,582 | $206,692 |
| 2019 | $3,928 | $289,485 | $86,845 | $202,640 |
| 2018 | $3,847 | $283,810 | $85,143 | $198,667 |
| 2017 | $3,751 | $278,247 | $83,474 | $194,773 |
| 2016 | $3,676 | $272,791 | $81,837 | $190,954 |
| 2015 | $3,616 | $268,695 | $80,608 | $188,087 |
| 2014 | $3,546 | $263,432 | $79,029 | $184,403 |
Source: Public Records
Map
Nearby Homes
- 39090 Presidio Way Unit 237
- 4237 Garland Dr
- 38837 Fremont Blvd
- 39530 Dorrington Ct
- 4714 Serra Ave
- 4328 Cognina Ct
- 39134 Memorial St
- 4754 Northdale Dr
- 38265 Corrigan Ct
- 4715 Eggers Dr
- 4600 Nelson St
- 38611 Country Common
- 3275 Capitol Ave
- 5033 Blacksand Rd
- 3833 Burton Common
- 3810 Burton Common
- 4586 Norris Rd
- 38324 Blacow Rd
- 3455 Gilman Common
- 3583 Madison Common
- 4335 Mowry Ave
- 4367 Mowry Ave
- 4338 Gertrude Dr
- 4320 Gertrude Dr
- 4356 Gertrude Dr
- 4319 Mowry Ave
- 4381 Mowry Ave
- 4374 Gertrude Dr
- 4303 Mowry Ave
- 4302 Gertrude Dr
- 4397 Mowry Ave
- 4392 Gertrude Dr
- 4291 Mowry Ave
- 4401 Mowry Ave
- 4303 Gertrude Dr
- 4325 Gertrude Dr
- 4402 Gertrude Dr
- 4347 Gertrude Dr
- 4332 Mowry Ave
- 4290 Marie Ct