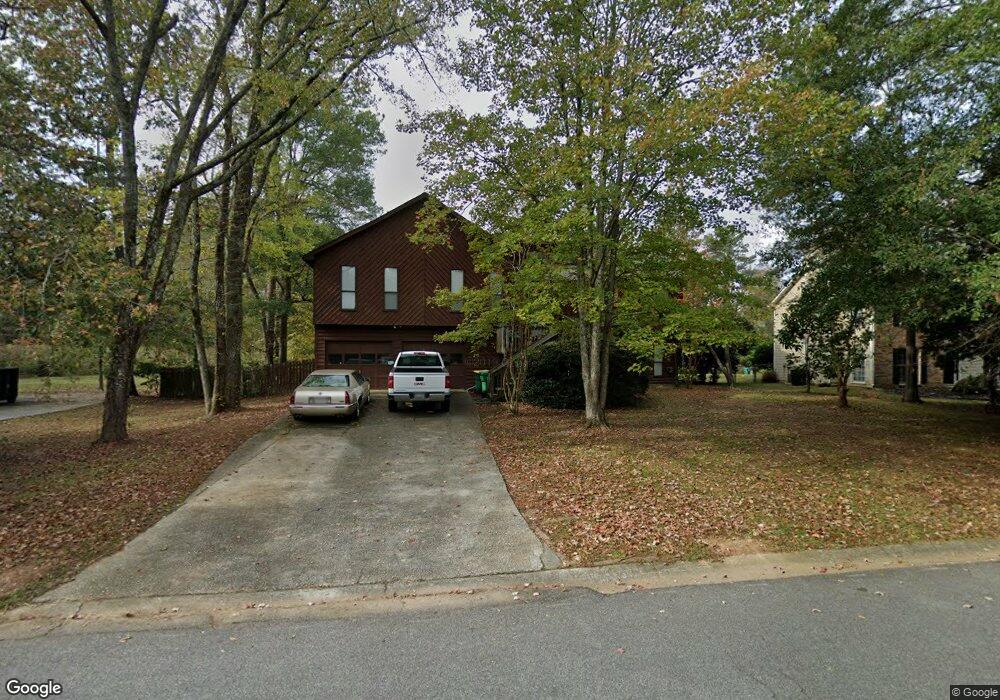
4352 Whitecap Ln Unit 2 Norcross, GA 30092
Estimated Value: $508,251 - $590,000
3
Beds
2
Baths
1,566
Sq Ft
$350/Sq Ft
Est. Value
About This Home
This home is located at 4352 Whitecap Ln Unit 2, Norcross, GA 30092 and is currently estimated at $548,813, approximately $350 per square foot. 4352 Whitecap Ln Unit 2 is a home located in Gwinnett County with nearby schools including Simpson Elementary School, Pinckneyville Middle School, and Norcross High School.
Ownership History
Date
Name
Owned For
Owner Type
Purchase Details
Closed on
Apr 1, 2015
Sold by
Hesterlee Katrina L
Bought by
Hesterlee Michael E
Current Estimated Value
Home Financials for this Owner
Home Financials are based on the most recent Mortgage that was taken out on this home.
Original Mortgage
$150,000
Outstanding Balance
$115,891
Interest Rate
3.84%
Mortgage Type
New Conventional
Estimated Equity
$432,922
Purchase Details
Closed on
Oct 15, 2001
Sold by
Edwards Herman J and Edwards Cheryl
Bought by
Hesterlee Michael E and Hesterlee Katrina L
Home Financials for this Owner
Home Financials are based on the most recent Mortgage that was taken out on this home.
Original Mortgage
$144,000
Interest Rate
6.57%
Mortgage Type
New Conventional
Purchase Details
Closed on
Mar 15, 1994
Sold by
Kinney Hugh D
Bought by
Edwards Herman J Cheryl
Home Financials for this Owner
Home Financials are based on the most recent Mortgage that was taken out on this home.
Original Mortgage
$120,510
Interest Rate
7%
Mortgage Type
VA
Create a Home Valuation Report for This Property
The Home Valuation Report is an in-depth analysis detailing your home's value as well as a comparison with similar homes in the area
Home Values in the Area
Average Home Value in this Area
Purchase History
| Date | Buyer | Sale Price | Title Company |
|---|---|---|---|
| Hesterlee Michael E | -- | -- | |
| Hesterlee Michael E | $180,000 | -- | |
| Edwards Herman J Cheryl | $117,000 | -- |
Source: Public Records
Mortgage History
| Date | Status | Borrower | Loan Amount |
|---|---|---|---|
| Open | Hesterlee Michael E | $150,000 | |
| Previous Owner | Hesterlee Michael E | $144,000 | |
| Previous Owner | Edwards Herman J Cheryl | $120,510 |
Source: Public Records
Tax History Compared to Growth
Tax History
| Year | Tax Paid | Tax Assessment Tax Assessment Total Assessment is a certain percentage of the fair market value that is determined by local assessors to be the total taxable value of land and additions on the property. | Land | Improvement |
|---|---|---|---|---|
| 2024 | $4,161 | $153,000 | $34,000 | $119,000 |
| 2023 | $4,161 | $153,000 | $34,000 | $119,000 |
| 2022 | $0 | $178,080 | $34,000 | $144,080 |
| 2021 | $3,629 | $123,280 | $24,000 | $99,280 |
| 2020 | $3,654 | $123,280 | $24,000 | $99,280 |
| 2019 | $3,574 | $123,280 | $24,000 | $99,280 |
| 2018 | $3,587 | $123,280 | $24,000 | $99,280 |
| 2016 | $2,945 | $95,440 | $24,000 | $71,440 |
| 2015 | $2,971 | $95,440 | $24,000 | $71,440 |
| 2014 | $2,847 | $95,440 | $24,000 | $71,440 |
Source: Public Records
Map
Nearby Homes
- 5067 Audley Ln
- 5062 Bridgeport Ln
- 5206 Creek Walk Cir
- 4916 Sudbrook Way Unit 253
- The Adams Plan at Waterside - Condos
- 4457 Watervale Way Unit 292
- 4477 Watervale Way Unit 286
- 5047 Shirley Oaks Dr Unit 313
- 4903 Sudbrook Way Unit 239
- The Stanley Plan at Waterside - Single Family
- The Stafford Plan at Waterside - Single Family
- 5039 Shirley Oaks Dr Unit 315
- 4479 Watervale Way Unit 285
- 5059 Shirley Oaks Dr Unit 309
- The Barrett II Plan at Waterside - Condos
- The Benton II Plan at Waterside - Townhomes
- 5134 Bandolino Ln Unit 320
- The Cascade Plan at Waterside - Condos
- The Grayson II Plan at Waterside - Single Family
- 5124 Bandolino Ln Unit 323
- 4362 Whitecap Ln
- 4342 Whitecap Ln
- 4342 Whitecap Ln Unit B
- 4342 Whitecap Ln Unit 13
- 0 Whitecap Ln Unit 8605240
- 0 Whitecap Ln Unit 8248771
- 0 Whitecap Ln Unit 8136167
- 0 Whitecap Ln Unit 8458013
- 0 Whitecap Ln Unit 7535127
- 0 Whitecap Ln Unit 8757957
- 0 Whitecap Ln Unit 8838669
- 0 Whitecap Ln
- 4372 Whitecap Ln
- 4961 Whitewater Dr Unit IIB
- 4981 Whitewater Dr
- 4353 Whitecap Ln
- 4970 Riverfield Dr Unit 3
- 4382 Whitecap Ln
- 4363 Whitecap Ln
- 4951 Whitewater Dr