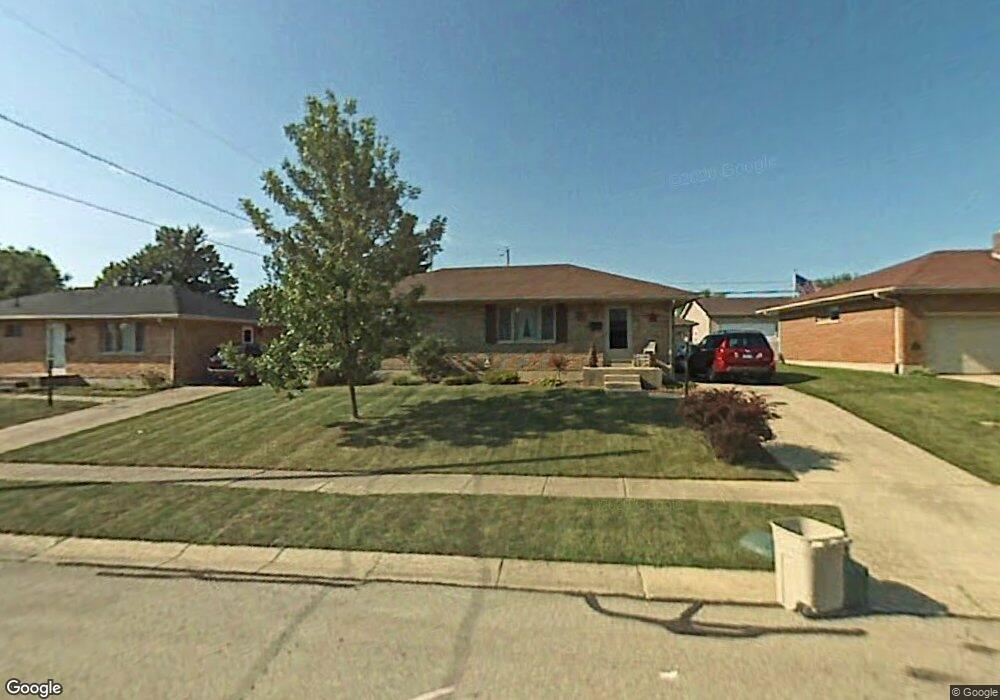
4354 Tudor Cir Springfield, OH 45503
Estimated Value: $208,814 - $228,000
2
Beds
2
Baths
1,075
Sq Ft
$201/Sq Ft
Est. Value
About This Home
This home is located at 4354 Tudor Cir, Springfield, OH 45503 and is currently estimated at $215,954, approximately $200 per square foot. 4354 Tudor Cir is a home located in Clark County with nearby schools including Rolling Hills Elementary School, Northridge Elementary School, and Northridge Middle School.
Ownership History
Date
Name
Owned For
Owner Type
Purchase Details
Closed on
Oct 15, 2012
Sold by
Clark Danielle L and Clark Nathan C
Bought by
Ross John N
Current Estimated Value
Home Financials for this Owner
Home Financials are based on the most recent Mortgage that was taken out on this home.
Original Mortgage
$78,400
Outstanding Balance
$13,533
Interest Rate
3.55%
Mortgage Type
New Conventional
Estimated Equity
$202,421
Purchase Details
Closed on
May 4, 2004
Sold by
Chase Daniel B and Chase Tammy S
Bought by
Clark Nathan C and Clark Danielle L
Home Financials for this Owner
Home Financials are based on the most recent Mortgage that was taken out on this home.
Original Mortgage
$104,362
Interest Rate
5.5%
Mortgage Type
FHA
Purchase Details
Closed on
Nov 30, 2003
Sold by
Chase Daniel B and Chase Tammy S
Bought by
Chase Daniel B and Chase Tammy S
Purchase Details
Closed on
Jun 17, 1999
Sold by
Kutter Janet L and Rice Janet L
Bought by
Chase Daniel B
Home Financials for this Owner
Home Financials are based on the most recent Mortgage that was taken out on this home.
Original Mortgage
$74,320
Interest Rate
7.06%
Mortgage Type
Purchase Money Mortgage
Create a Home Valuation Report for This Property
The Home Valuation Report is an in-depth analysis detailing your home's value as well as a comparison with similar homes in the area
Home Values in the Area
Average Home Value in this Area
Purchase History
| Date | Buyer | Sale Price | Title Company |
|---|---|---|---|
| Ross John N | $98,000 | None Available | |
| Clark Nathan C | $106,000 | -- | |
| Chase Daniel B | -- | -- | |
| Chase Daniel B | $92,900 | -- |
Source: Public Records
Mortgage History
| Date | Status | Borrower | Loan Amount |
|---|---|---|---|
| Open | Ross John N | $78,400 | |
| Previous Owner | Clark Nathan C | $104,362 | |
| Previous Owner | Chase Daniel B | $74,320 |
Source: Public Records
Tax History Compared to Growth
Tax History
| Year | Tax Paid | Tax Assessment Tax Assessment Total Assessment is a certain percentage of the fair market value that is determined by local assessors to be the total taxable value of land and additions on the property. | Land | Improvement |
|---|---|---|---|---|
| 2024 | -- | $45,390 | $9,720 | $35,670 |
| 2023 | $1,919 | $45,390 | $9,720 | $35,670 |
| 2022 | $754 | $45,390 | $9,720 | $35,670 |
| 2021 | $1,940 | $38,710 | $7,200 | $31,510 |
| 2020 | $1,635 | $38,710 | $7,200 | $31,510 |
| 2019 | $1,979 | $38,710 | $7,200 | $31,510 |
| 2018 | $1,925 | $36,100 | $9,170 | $26,930 |
| 2017 | $1,650 | $33,534 | $9,174 | $24,360 |
| 2016 | $1,638 | $33,534 | $9,174 | $24,360 |
| 2015 | $1,507 | $33,180 | $8,820 | $24,360 |
| 2014 | $1,507 | $33,180 | $8,820 | $24,360 |
| 2013 | $1,472 | $33,180 | $8,820 | $24,360 |
Source: Public Records
Map
Nearby Homes
- 970 Forest Edge Ave
- 1461 Student Ave
- 4109 Derr Rd
- 4622 W Ridgewood Rd
- 1139 Greenoak Ct
- 916 Sawmill Ct
- 4712 Cullen Ave
- 880 Brendle Trace Unit 28
- 4514 Dowden St
- 4446 Ridgewood Rd E Unit 3
- 794 Donnelly Ave
- 4512 Ridgewood Rd E
- 4438 Tacoma St
- 1640 Montego Dr
- 4050 Tacoma St
- 593 Hiser Ave
- 1162 Kingsgate Rd
- 4740 Merrimont Ave
- 4321 Tulane Rd
- 4362 Tudor Cir
- 4346 Tudor Cir
- 1125 Student Ave
- 1119 Student Ave
- 4370 Tudor Cir
- 1131 Student Ave
- 1113 Student Ave
- 4345 Tudor Cir
- 4365 Tudor Cir
- 4338 Tudor Cir
- 1137 Student Ave
- 4307 Tudor Cir
- 1126 Student Ave
- 4331 Tritle Trail
- 4330 Tudor Cir
- 4304 Tritle Trail
- 1116 Student Ave
- 1143 Student Ave
- 4322 Tudor Cir
- 4319 Tritle Trail