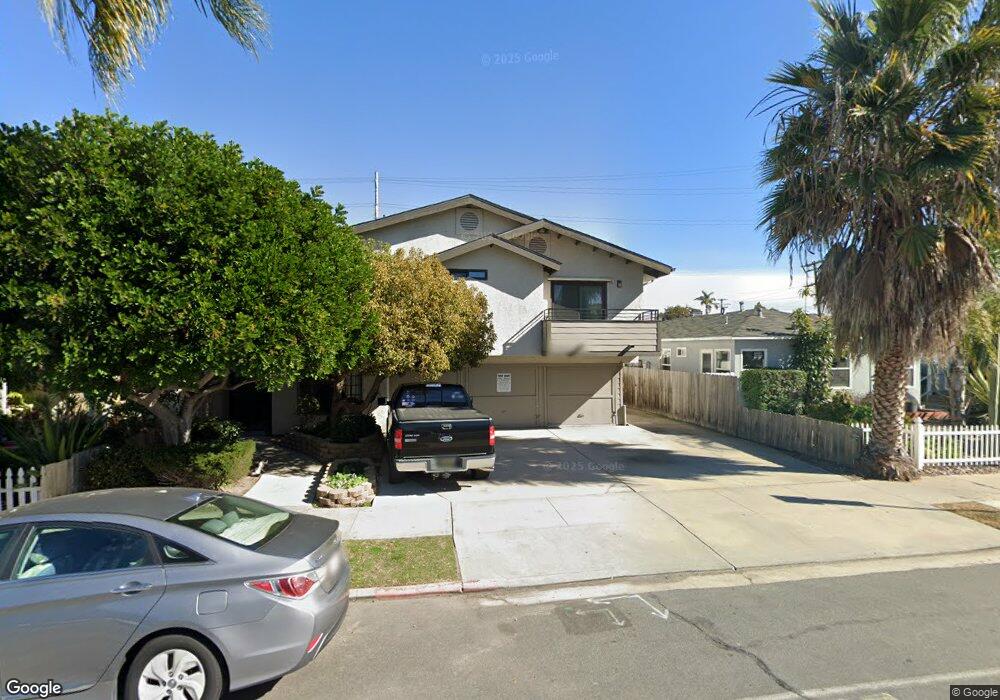
4355 Utah St Unit 5 San Diego, CA 92104
North Park NeighborhoodEstimated Value: $514,580 - $650,000
2
Beds
1
Bath
764
Sq Ft
$741/Sq Ft
Est. Value
About This Home
This home is located at 4355 Utah St Unit 5, San Diego, CA 92104 and is currently estimated at $566,395, approximately $741 per square foot. 4355 Utah St Unit 5 is a home located in San Diego County with nearby schools including Garfield Elementary, Roosevelt International Middle School, and North Park Christian School.
Ownership History
Date
Name
Owned For
Owner Type
Purchase Details
Closed on
Jul 20, 2009
Sold by
The Bank Of New York Mellon
Bought by
Cabay Cynthia M
Current Estimated Value
Home Financials for this Owner
Home Financials are based on the most recent Mortgage that was taken out on this home.
Original Mortgage
$194,413
Outstanding Balance
$126,822
Interest Rate
5.3%
Mortgage Type
FHA
Estimated Equity
$439,573
Purchase Details
Closed on
Jun 10, 2009
Sold by
Prendergast Mark T
Bought by
The Bank Of New York Mellon
Home Financials for this Owner
Home Financials are based on the most recent Mortgage that was taken out on this home.
Original Mortgage
$194,413
Outstanding Balance
$126,822
Interest Rate
5.3%
Mortgage Type
FHA
Estimated Equity
$439,573
Purchase Details
Closed on
Feb 6, 2006
Sold by
Prendergast Mark T
Bought by
Prendergast Mark T and Stout Dayna J
Purchase Details
Closed on
Dec 16, 2004
Sold by
Detlefsen John
Bought by
Prendergast Mark T
Home Financials for this Owner
Home Financials are based on the most recent Mortgage that was taken out on this home.
Original Mortgage
$245,600
Interest Rate
5.75%
Mortgage Type
Purchase Money Mortgage
Purchase Details
Closed on
Apr 22, 1986
Create a Home Valuation Report for This Property
The Home Valuation Report is an in-depth analysis detailing your home's value as well as a comparison with similar homes in the area
Home Values in the Area
Average Home Value in this Area
Purchase History
| Date | Buyer | Sale Price | Title Company |
|---|---|---|---|
| Cabay Cynthia M | $198,000 | Lsi Title Agency | |
| The Bank Of New York Mellon | $154,615 | Fidelity Natl Title Ins Co | |
| Prendergast Mark T | -- | None Available | |
| Prendergast Mark T | $307,000 | Commonwealth Title | |
| -- | $63,900 | -- |
Source: Public Records
Mortgage History
| Date | Status | Borrower | Loan Amount |
|---|---|---|---|
| Open | Cabay Cynthia M | $194,413 | |
| Previous Owner | Prendergast Mark T | $245,600 | |
| Closed | Prendergast Mark T | $61,400 |
Source: Public Records
Tax History Compared to Growth
Tax History
| Year | Tax Paid | Tax Assessment Tax Assessment Total Assessment is a certain percentage of the fair market value that is determined by local assessors to be the total taxable value of land and additions on the property. | Land | Improvement |
|---|---|---|---|---|
| 2025 | $3,131 | $255,566 | $192,325 | $63,241 |
| 2024 | $3,131 | $250,555 | $188,554 | $62,001 |
| 2023 | $3,062 | $245,643 | $184,857 | $60,786 |
| 2022 | $2,980 | $240,828 | $181,233 | $59,595 |
| 2021 | $2,958 | $236,107 | $177,680 | $58,427 |
| 2020 | $2,923 | $233,687 | $175,859 | $57,828 |
| 2019 | $2,871 | $229,106 | $172,411 | $56,695 |
| 2018 | $2,686 | $224,615 | $169,031 | $55,584 |
| 2017 | $2,622 | $220,212 | $165,717 | $54,495 |
| 2016 | $2,580 | $215,895 | $162,468 | $53,427 |
| 2015 | $2,542 | $212,653 | $160,028 | $52,625 |
| 2014 | $2,503 | $208,489 | $156,894 | $51,595 |
Source: Public Records
Map
Nearby Homes
- 4355 Utah St Unit 2
- 4367 Idaho St Unit 5
- 4432 Kansas St Unit C
- 4226 Utah St
- 2717 Meade Ave
- 4347 30th St Unit 53
- 4381 Oregon St Unit 6
- 4366 Ohio St
- 4473 30th St Unit 506
- 4473 30th St Unit 407
- 4473 30th St Unit 218
- 4473 30th St Unit 505
- 4473 30th St Unit 402
- 4153-55 Utah St
- 2730 Monroe Ave
- 4205 Ohio St Unit 204
- 4205 Ohio St Unit 106
- 4119-23 Kansas
- 4075 Idaho St Unit 2
- 4074 30th St
- 4355 Utah St Unit 3
- 4355 Utah St Unit 1
- 4355 Utah St Unit 7
- 4355 Utah St Unit 6
- 4355 Utah St Unit 4
- 4361 Utah St Unit 65
- 4369 Utah St
- 4367.5 Utah St
- 4367 Utah St
- 4341 Utah St
- 4373 Utah St Unit 75
- 4329 Utah St Unit A
- 4329 Utah St
- 4360 Kansas St
- 4354 Kansas St
- 4368 Kansas St
- 4346 Kansas St
- 4340 Kansas St
- 4370 Kansas St Unit 76
- 4381 Utah St