Estimated Value: $462,253 - $514,000
3
Beds
2
Baths
2,071
Sq Ft
$239/Sq Ft
Est. Value
About This Home
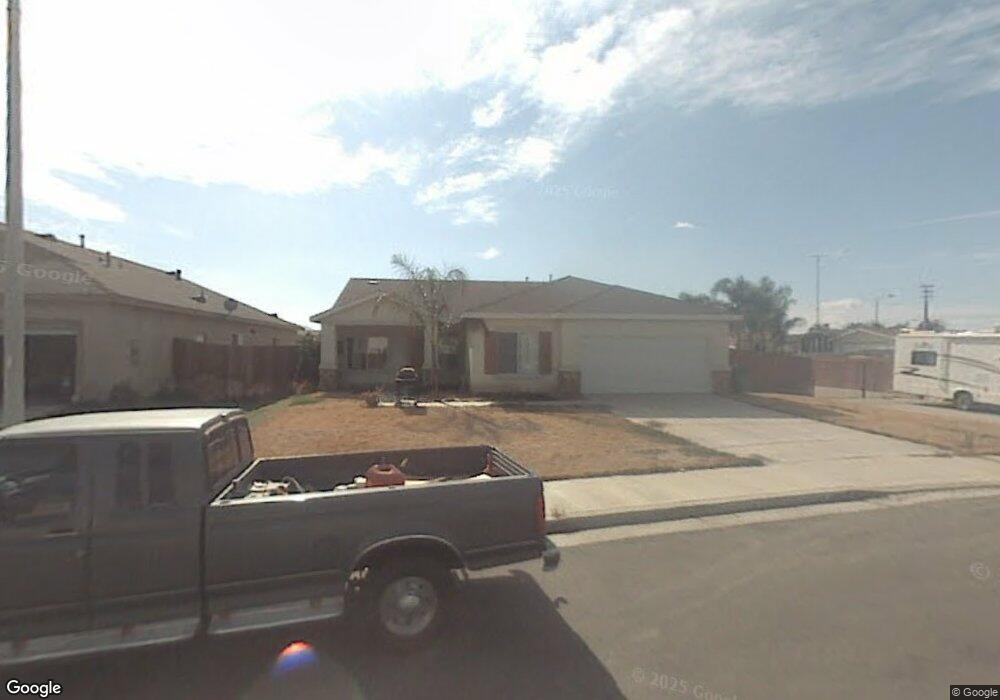
This home is located at 43563 Savannah Way, Hemet, CA 92544 and is currently estimated at $495,563, approximately $239 per square foot. 43563 Savannah Way is a home located in Riverside County with nearby schools including Bautista Creek Elementary School, Acacia Middle School, and Hemet High School.
Ownership History
Date
Name
Owned For
Owner Type
Purchase Details
Closed on
Oct 12, 2009
Sold by
Wachovia Mortgage Fsb
Bought by
Olen Karen and Karen Olen Living Trust
Current Estimated Value
Purchase Details
Closed on
Sep 15, 2009
Sold by
Eldridge Brondon James and Eldridge Sonia Hope
Bought by
Wachovia Mortgage Fsb and World Savings Bank Fsb
Purchase Details
Closed on
Jun 11, 2003
Sold by
Swartz Robert and Swartz Lindsay
Bought by
Eldridge Brondon James and Eldridge Sonia Hope
Home Financials for this Owner
Home Financials are based on the most recent Mortgage that was taken out on this home.
Original Mortgage
$173,600
Interest Rate
5.87%
Mortgage Type
Purchase Money Mortgage
Purchase Details
Closed on
Aug 1, 2002
Sold by
K Hovnanian Forecast Homes Inc
Bought by
Swartz Robert and Swartz Lindsay
Home Financials for this Owner
Home Financials are based on the most recent Mortgage that was taken out on this home.
Original Mortgage
$156,772
Interest Rate
8.5%
Create a Home Valuation Report for This Property
The Home Valuation Report is an in-depth analysis detailing your home's value as well as a comparison with similar homes in the area
Home Values in the Area
Average Home Value in this Area
Purchase History
| Date | Buyer | Sale Price | Title Company |
|---|---|---|---|
| Olen Karen | $131,000 | Lawyers Title Company | |
| Wachovia Mortgage Fsb | $109,591 | Stewart Title | |
| Eldridge Brondon James | $226,000 | New Century Title Company | |
| Swartz Robert | $174,500 | Orange Coast Title |
Source: Public Records
Mortgage History
| Date | Status | Borrower | Loan Amount |
|---|---|---|---|
| Previous Owner | Eldridge Brondon James | $173,600 | |
| Previous Owner | Swartz Robert | $156,772 |
Source: Public Records
Tax History Compared to Growth
Tax History
| Year | Tax Paid | Tax Assessment Tax Assessment Total Assessment is a certain percentage of the fair market value that is determined by local assessors to be the total taxable value of land and additions on the property. | Land | Improvement |
|---|---|---|---|---|
| 2025 | $2,634 | $169,077 | $38,714 | $130,363 |
| 2023 | $2,634 | $162,512 | $37,211 | $125,301 |
| 2022 | $2,604 | $159,327 | $36,482 | $122,845 |
| 2021 | $2,552 | $156,204 | $35,767 | $120,437 |
| 2020 | $2,535 | $154,604 | $35,401 | $119,203 |
| 2019 | $2,486 | $151,573 | $34,707 | $116,866 |
| 2018 | $2,429 | $148,602 | $34,027 | $114,575 |
| 2017 | $2,418 | $145,689 | $33,360 | $112,329 |
| 2016 | $2,406 | $142,833 | $32,706 | $110,127 |
| 2015 | $2,408 | $140,690 | $32,216 | $108,474 |
| 2014 | $2,337 | $137,936 | $31,586 | $106,350 |
Source: Public Records
Map
Nearby Homes
- 24967 Volga St
- 43608 Savannah Way
- 43560 Holder Ave
- 24856 Loire Ct
- 25047 Brazos Ct
- 43435 Bos Cir
- 25140 W Posey Dr
- 25139 W Posey Dr
- 43692 Ange Ln
- 25152 Omni Dr
- 24925 Barnett Dr
- 25157 Omni Dr
- 43628 Cyril Ln
- 43362 Nita Cir
- 43434 Dessie Way
- 43765 Orinoco Ln
- 43771 Applewood St
- 43378 Nola St
- 24967 Rosebrugh Ln
- 25289 De Waide Ave
- 43573 Savannah Way
- 43550 Gaylord Ave
- 43583 Savannah Way
- 24983 W Posey Dr
- 24952 Volga St
- 24991 W Posey Dr
- 43574 Gaylord Ave
- 4362 Gaylord Ave
- 43578 Savannah Way
- 43593 Savannah Way
- 24947 Volga St
- 24942 Volga St
- 43592 Yukon Ct
- 24937 Volga St
- 43563 Gaylord Ave
- 25015 W Posey Dr
- 24922 Volga St
- 43602 Yukon Ct
- 43485 Edith Way
- 43598 Savannah Way