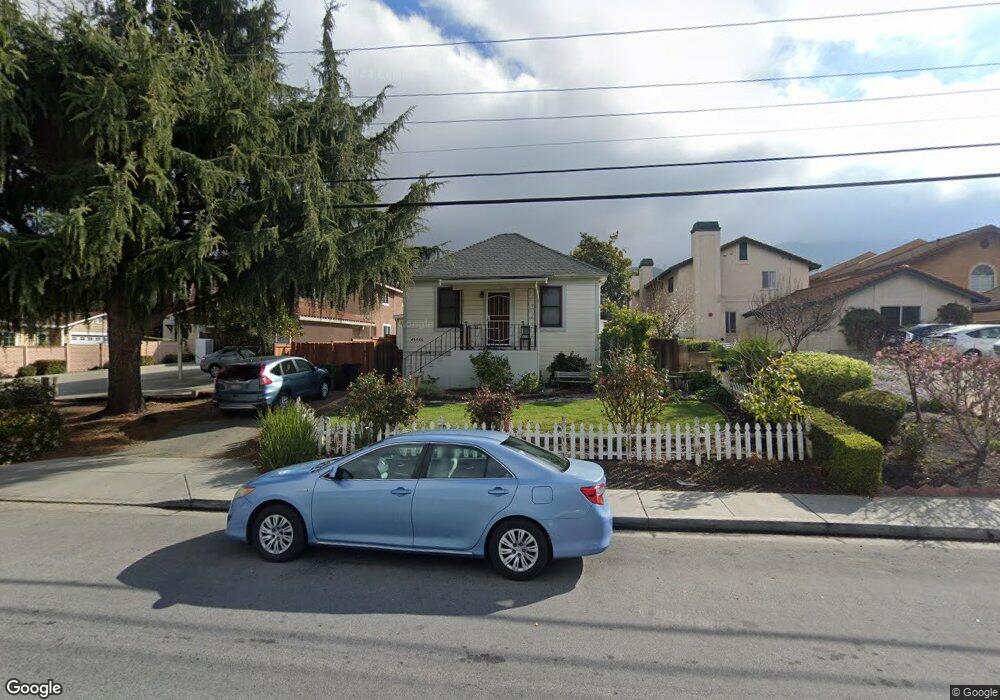
43568 Bryant St Fremont, CA 94539
Mission San Jose NeighborhoodEstimated Value: $2,365,000 - $3,216,000
6
Beds
8
Baths
3,640
Sq Ft
$755/Sq Ft
Est. Value
About This Home
This home is located at 43568 Bryant St, Fremont, CA 94539 and is currently estimated at $2,749,216, approximately $755 per square foot. 43568 Bryant St is a home located in Alameda County with nearby schools including Mission San Jose Elementary School, William Hopkins Junior High School, and Mission San Jose High School.
Ownership History
Date
Name
Owned For
Owner Type
Purchase Details
Closed on
Jun 18, 2019
Sold by
Bettencourt Fatima La Salette and Betencourt Family Living Trust
Bought by
Wadhera Kapil and Wadhera Nishi
Current Estimated Value
Home Financials for this Owner
Home Financials are based on the most recent Mortgage that was taken out on this home.
Original Mortgage
$1,462,500
Outstanding Balance
$1,258,053
Interest Rate
3.08%
Mortgage Type
Adjustable Rate Mortgage/ARM
Estimated Equity
$1,491,163
Purchase Details
Closed on
Jan 15, 2019
Sold by
Bettencourt Fatima La Salette
Bought by
Bettencourt Fatima La Salette and Bettencourt Family Living Trus
Purchase Details
Closed on
May 26, 2016
Sold by
Bettencourt David Allan and Bettencourt Fatima La Salette
Bought by
Bettencourt David Allan and Bettencourt Fatima La Salette
Home Financials for this Owner
Home Financials are based on the most recent Mortgage that was taken out on this home.
Original Mortgage
$417,000
Interest Rate
3.5%
Mortgage Type
New Conventional
Purchase Details
Closed on
Jun 14, 2012
Sold by
Bettencourt David A and Bettencourt Fatima
Bought by
Bettencourt David Allan and Bettencourt Fatima La Salette
Purchase Details
Closed on
Dec 6, 2007
Sold by
Bettencourt David A
Bought by
Bettencourt David A and Bettencourt Fatima
Home Financials for this Owner
Home Financials are based on the most recent Mortgage that was taken out on this home.
Original Mortgage
$489,000
Interest Rate
6.2%
Mortgage Type
Purchase Money Mortgage
Purchase Details
Closed on
Jun 14, 2001
Sold by
Bettencourt Fatima L
Bought by
Bettencourt David A
Purchase Details
Closed on
Jul 24, 1996
Sold by
Bettencourt David A
Bought by
Bettencourt David A and The David A Bettencourt Trust
Purchase Details
Closed on
Sep 8, 1995
Sold by
Dyer John H and Dyer Deborah A
Bought by
Bettencourt David A
Home Financials for this Owner
Home Financials are based on the most recent Mortgage that was taken out on this home.
Original Mortgage
$305,000
Interest Rate
7.83%
Purchase Details
Closed on
Mar 13, 1995
Sold by
Dyer John H and Dyer Deborah A
Bought by
Dyer John H and Dyer Deborah A
Home Financials for this Owner
Home Financials are based on the most recent Mortgage that was taken out on this home.
Original Mortgage
$300,000
Interest Rate
11.75%
Create a Home Valuation Report for This Property
The Home Valuation Report is an in-depth analysis detailing your home's value as well as a comparison with similar homes in the area
Home Values in the Area
Average Home Value in this Area
Purchase History
| Date | Buyer | Sale Price | Title Company |
|---|---|---|---|
| Wadhera Kapil | $1,975,000 | First American Title Company | |
| Bettencourt Fatima La Salette | -- | None Available | |
| Bettencourt David Allan | -- | None Available | |
| Bettencourt David Allan | -- | None Available | |
| Bettencourt David A | -- | Chicago Title Company | |
| Bettencourt David A | -- | Chicago Title Co | |
| Bettencourt David A | -- | Chicago Title Co | |
| Bettencourt David A | -- | -- | |
| Bettencourt David A | $515,000 | Northwestern Title Company | |
| Dyer John H | -- | Chicago Title Company |
Source: Public Records
Mortgage History
| Date | Status | Borrower | Loan Amount |
|---|---|---|---|
| Open | Wadhera Kapil | $1,462,500 | |
| Previous Owner | Bettencourt David Allan | $417,000 | |
| Previous Owner | Bettencourt David A | $489,000 | |
| Previous Owner | Bettencourt David A | $305,000 | |
| Previous Owner | Dyer John H | $300,000 |
Source: Public Records
Tax History Compared to Growth
Tax History
| Year | Tax Paid | Tax Assessment Tax Assessment Total Assessment is a certain percentage of the fair market value that is determined by local assessors to be the total taxable value of land and additions on the property. | Land | Improvement |
|---|---|---|---|---|
| 2025 | $25,955 | $2,159,919 | $874,904 | $1,285,015 |
| 2024 | $25,955 | $2,117,575 | $857,752 | $1,259,823 |
| 2023 | $25,254 | $2,076,060 | $840,936 | $1,235,124 |
| 2022 | $24,924 | $2,035,356 | $824,448 | $1,210,908 |
| 2021 | $24,329 | $1,995,461 | $808,288 | $1,187,173 |
| 2020 | $24,354 | $1,975,000 | $800,000 | $1,175,000 |
| 2019 | $10,396 | $766,917 | $230,075 | $536,842 |
| 2018 | $10,186 | $751,884 | $225,565 | $526,319 |
| 2017 | $9,929 | $737,144 | $221,143 | $516,001 |
| 2016 | $9,751 | $722,694 | $216,808 | $505,886 |
| 2015 | $9,625 | $711,842 | $213,552 | $498,290 |
| 2014 | $9,460 | $697,901 | $209,370 | $488,531 |
Source: Public Records
Map
Nearby Homes
- 43547 Ellsworth St
- 483 Becado Place
- 43382 Bryant St
- 341 Dana St
- 646 Bella Vista Ct
- 43150 Starr St
- 905 Glenhill Dr
- 42099 Vinha Way
- 138 Telles Ln
- 42965 Corte Verde
- 42955 Corte Verde
- 335 Via Rosario
- 43555 Puesta Del Sol
- 124 Linmore Dr
- 379 Felipe Common
- 44423 View Point Cir
- 2164 Ocaso Camino
- 2450 Euclid Place
- 42329 Troyer Ave
- 44989 Vista Del Sol
- 43572 Bryant St
- 43566 Bryant St
- 43574 Bryant St
- 43576 Bryant St
- 43560 Bryant St
- 43578 Bryant St
- 43552 Bryant St
- 43569 Ellsworth St
- 43569 Ellsworth St
- 43586 Bryant St
- 43563 Ellsworth St Unit 1
- 43563 Ellsworth St
- 43575 Ellsworth St
- 43559 Ellsworth St
- 43544 Bryant St
- 43592 Bryant St
- 43553 Ellsworth St Unit B
- 43553 Ellsworth St
- 295 Cedar St
- 43599 Ellsworth St