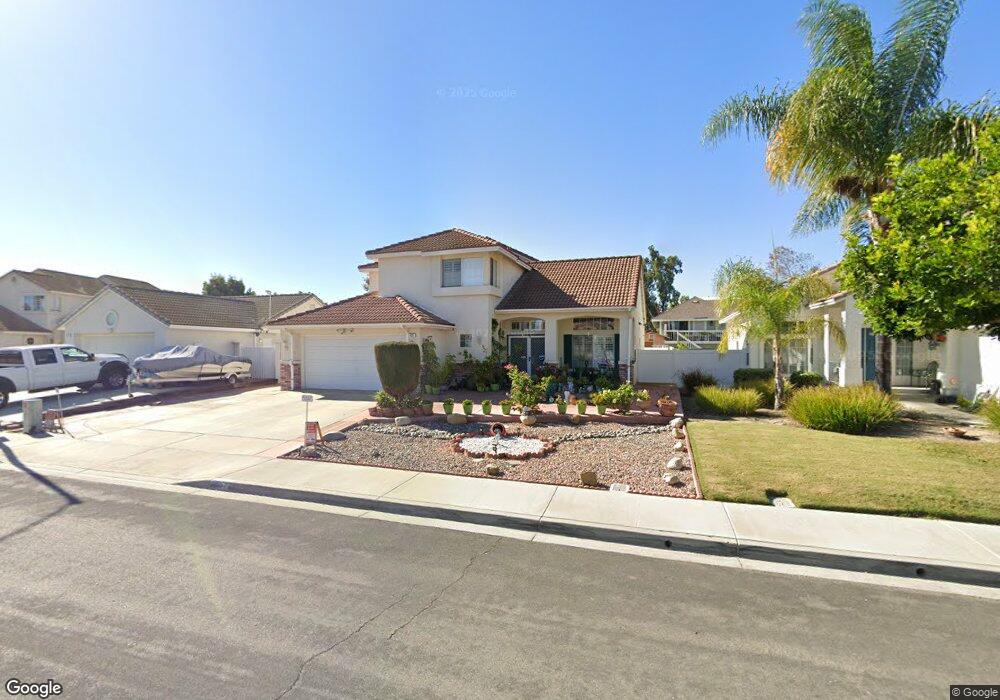
4357 Arbor Cove Cir Oceanside, CA 92058
North Valley NeighborhoodEstimated Value: $946,892 - $1,023,000
4
Beds
3
Baths
2,308
Sq Ft
$426/Sq Ft
Est. Value
About This Home
This home is located at 4357 Arbor Cove Cir, Oceanside, CA 92058 and is currently estimated at $983,473, approximately $426 per square foot. 4357 Arbor Cove Cir is a home located in San Diego County with nearby schools including Louise Foussat Elementary School, Martin Luther King Jr. Middle School, and El Camino High School.
Ownership History
Date
Name
Owned For
Owner Type
Purchase Details
Closed on
Mar 7, 2016
Sold by
Lazaga Jacqueline
Bought by
Lazaga Jacqueline G
Current Estimated Value
Purchase Details
Closed on
Jan 12, 2016
Sold by
Lazaga Nestor
Bought by
Lazaga Jacqueline
Purchase Details
Closed on
Dec 3, 2003
Sold by
Lazaga Nestor and Lazaga Jacqueline
Bought by
Lazaga Nestor and Lazaga Jacqueline
Home Financials for this Owner
Home Financials are based on the most recent Mortgage that was taken out on this home.
Original Mortgage
$200,000
Interest Rate
6.03%
Mortgage Type
Unknown
Purchase Details
Closed on
Sep 27, 1996
Sold by
Guevara Rosemarie
Bought by
Guevara Marty Martinez
Purchase Details
Closed on
Jul 22, 1996
Sold by
The Forecast Group Lp
Bought by
Lazaga Nestor and Lazaga Jacqueline
Create a Home Valuation Report for This Property
The Home Valuation Report is an in-depth analysis detailing your home's value as well as a comparison with similar homes in the area
Home Values in the Area
Average Home Value in this Area
Purchase History
| Date | Buyer | Sale Price | Title Company |
|---|---|---|---|
| Lazaga Jacqueline G | -- | None Available | |
| Lazaga Jacqueline | -- | None Available | |
| Lazaga Nestor | -- | Stewart Title Company | |
| Guevara Marty Martinez | -- | Orange Coast Title | |
| Lazaga Nestor | $173,000 | Orange Coast Title Company |
Source: Public Records
Mortgage History
| Date | Status | Borrower | Loan Amount |
|---|---|---|---|
| Closed | Lazaga Nestor | $200,000 |
Source: Public Records
Tax History
| Year | Tax Paid | Tax Assessment Tax Assessment Total Assessment is a certain percentage of the fair market value that is determined by local assessors to be the total taxable value of land and additions on the property. | Land | Improvement |
|---|---|---|---|---|
| 2025 | $3,246 | $287,954 | $49,351 | $238,603 |
| 2024 | $3,246 | $282,309 | $48,384 | $233,925 |
| 2023 | $3,146 | $276,775 | $47,436 | $229,339 |
| 2022 | $3,096 | $271,349 | $46,506 | $224,843 |
| 2021 | $3,104 | $266,030 | $45,595 | $220,435 |
| 2020 | $3,010 | $263,303 | $45,128 | $218,175 |
| 2019 | $2,923 | $258,142 | $44,244 | $213,898 |
| 2018 | $2,889 | $253,081 | $43,377 | $209,704 |
| 2017 | $2,835 | $248,120 | $42,527 | $205,593 |
| 2016 | $2,820 | $243,256 | $41,694 | $201,562 |
| 2015 | $1,370 | $239,603 | $41,068 | $198,535 |
| 2014 | $1,310 | $234,910 | $40,264 | $194,646 |
Source: Public Records
Map
Nearby Homes
- 638 Sumner Way Unit 4
- 625 Sumner Way Unit 4
- 814 Malibu Point Way
- 4484 Brisbane Way Unit 3
- 4475 Saint Andrews Place
- 4413 Point Degada
- 4422 Point Degada
- 4499 Pebble Beach Dr
- 505 Portico Dr
- 4467 Anne Sladon St
- 4588 Vinyard St
- 318 Festival Dr
- 156 Avenida Descanso
- 3904 Cadena Dr
- 4560 Calle Del Palo
- 3672 Cypress Rd
- 4616 N River Rd Unit 89
- 4045 Via Los Padres
- 4660 N River Rd Unit 150
- 4660 N River Rd Unit 116
- 4353 Arbor Cove Cir
- 4361 Arbor Cove Cir
- 4349 Arbor Cove Cir
- 4365 Arbor Cove Cir
- 4380 Arbor Cove Cir
- 4352 Arbor Cove Cir
- 860 Cypress Point Way
- 856 Cypress Point Way
- 762 Timber Cove Way Unit 222
- 763 Timber Cove Way
- 4345 Arbor Cove Cir
- 4348 Arbor Cove Cir
- 751 Timber Cove Way
- 755 Timber Cove Way Unit 219
- 4369 Arbor Cove Cir
- 4344 Arbor Cove Cir
- 770 Timber Cove Way Unit 227
- 4384 Arbor Cove Cir
- 754 Timber Cove Way
- 759 Timber Cove Way
Your Personal Tour Guide
Ask me questions while you tour the home.