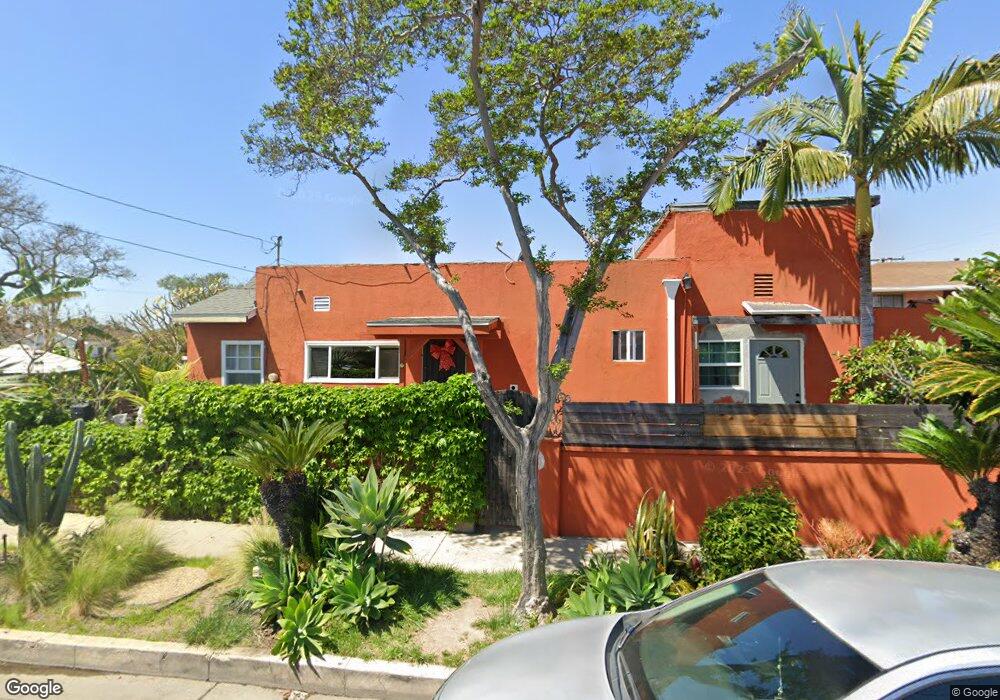
4357 E 53rd St Maywood, CA 90270
Estimated Value: $678,146 - $733,000
3
Beds
3
Baths
1,536
Sq Ft
$460/Sq Ft
Est. Value
About This Home
This home is located at 4357 E 53rd St, Maywood, CA 90270 and is currently estimated at $707,287, approximately $460 per square foot. 4357 E 53rd St is a home located in Los Angeles County with nearby schools including Maywood Elementary School, Chester W. Nimitz Middle School, and Maywood Academy High School.
Ownership History
Date
Name
Owned For
Owner Type
Purchase Details
Closed on
Dec 23, 2003
Sold by
Herrera Jesus
Bought by
Herrera Jesus and Herrera Maria E
Current Estimated Value
Home Financials for this Owner
Home Financials are based on the most recent Mortgage that was taken out on this home.
Original Mortgage
$144,980
Interest Rate
5.81%
Mortgage Type
Purchase Money Mortgage
Purchase Details
Closed on
Nov 10, 2000
Sold by
Herrera Jesus
Bought by
Herrera Jesus and Herrera Maria E
Home Financials for this Owner
Home Financials are based on the most recent Mortgage that was taken out on this home.
Original Mortgage
$117,080
Interest Rate
7.71%
Purchase Details
Closed on
Aug 27, 1996
Sold by
Herrera Liliana
Bought by
Herrera Jose
Home Financials for this Owner
Home Financials are based on the most recent Mortgage that was taken out on this home.
Original Mortgage
$118,750
Interest Rate
8.23%
Purchase Details
Closed on
Jul 16, 1996
Sold by
Cuevas Jorge
Bought by
Herrera Jesus and Herrera Jose
Home Financials for this Owner
Home Financials are based on the most recent Mortgage that was taken out on this home.
Original Mortgage
$118,750
Interest Rate
8.23%
Create a Home Valuation Report for This Property
The Home Valuation Report is an in-depth analysis detailing your home's value as well as a comparison with similar homes in the area
Home Values in the Area
Average Home Value in this Area
Purchase History
| Date | Buyer | Sale Price | Title Company |
|---|---|---|---|
| Herrera Jesus | -- | First Southwestern Title Ca | |
| Herrera Jesus | -- | Stewart Title | |
| Herrera Jose | -- | -- | |
| Herrera Jesus | -- | -- | |
| Herrera Jesus | $125,000 | -- |
Source: Public Records
Mortgage History
| Date | Status | Borrower | Loan Amount |
|---|---|---|---|
| Closed | Herrera Jesus | $144,980 | |
| Closed | Herrera Jesus | $117,080 | |
| Previous Owner | Herrera Jesus | $118,750 |
Source: Public Records
Tax History
| Year | Tax Paid | Tax Assessment Tax Assessment Total Assessment is a certain percentage of the fair market value that is determined by local assessors to be the total taxable value of land and additions on the property. | Land | Improvement |
|---|---|---|---|---|
| 2025 | $4,217 | $286,964 | $122,857 | $164,107 |
| 2024 | $4,217 | $281,339 | $120,449 | $160,890 |
| 2023 | $4,146 | $275,824 | $118,088 | $157,736 |
| 2022 | $3,973 | $270,417 | $115,773 | $154,644 |
| 2021 | $3,918 | $265,115 | $113,503 | $151,612 |
| 2019 | $3,798 | $257,254 | $110,138 | $147,116 |
| 2018 | $3,686 | $252,211 | $107,979 | $144,232 |
| 2016 | $3,454 | $242,419 | $103,787 | $138,632 |
| 2015 | $3,259 | $238,779 | $102,229 | $136,550 |
| 2014 | $3,256 | $234,103 | $100,227 | $133,876 |
Source: Public Records
Map
Nearby Homes
- 5202 Gifford Ave
- 4101 E 57th St
- 4212 E 58th St
- 4301 E 60th St
- 3738 E 53rd St
- 5824 Heliotrope Ave
- 3725 E 57th St
- 3700 E 55th St
- 6048 King Ave
- 6072 Gifford Ave
- 5115 Loma Vista Ave
- 5517 Loma Vista Ave
- 4020 E 61st St
- 4957 E 59th Place
- 3519 E 60th St
- 5716 Maywood Ave
- 6221 Heliotrope Ave
- 6122 Wilcox Ave
- 6152 Wilcox Ave
- 3602 Randolph Place
Your Personal Tour Guide
Ask me questions while you tour the home.