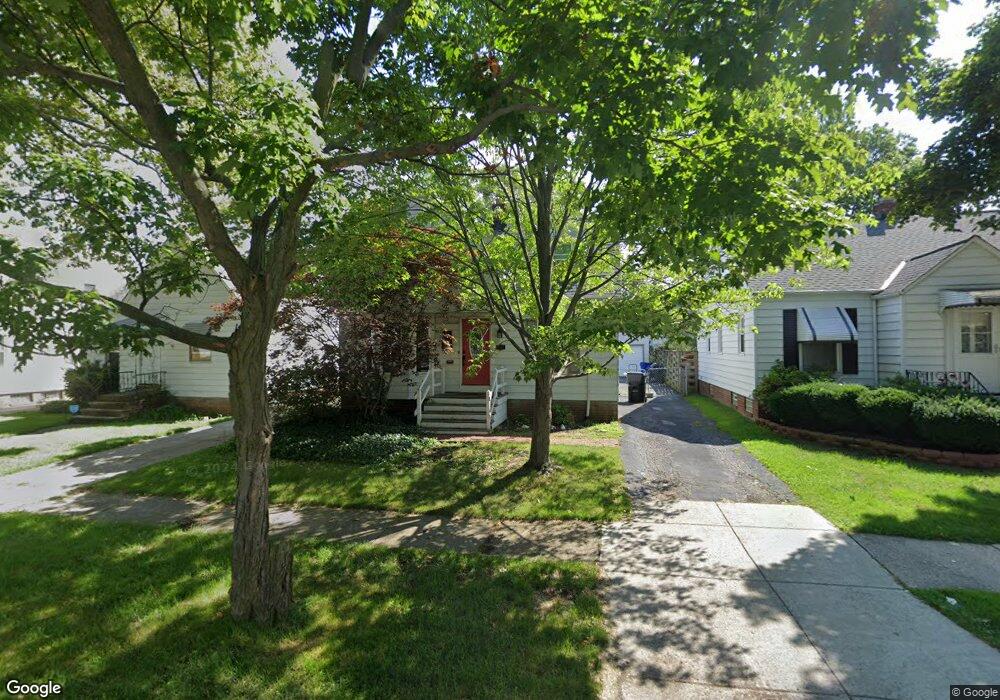
4357 W 58th St Cleveland, OH 44144
Old Brooklyn NeighborhoodEstimated Value: $143,541 - $191,000
3
Beds
1
Bath
1,270
Sq Ft
$134/Sq Ft
Est. Value
About This Home
This home is located at 4357 W 58th St, Cleveland, OH 44144 and is currently estimated at $170,385, approximately $134 per square foot. 4357 W 58th St is a home located in Cuyahoga County with nearby schools including Benjamin Franklin, Almira Academy, and Artemus Ward School.
Ownership History
Date
Name
Owned For
Owner Type
Purchase Details
Closed on
May 15, 2008
Sold by
Folger Andrew P and Folger Chere A
Bought by
Cron Jeremy K and Van Kirk Jill M
Current Estimated Value
Home Financials for this Owner
Home Financials are based on the most recent Mortgage that was taken out on this home.
Original Mortgage
$2,895
Outstanding Balance
$1,838
Interest Rate
5.93%
Mortgage Type
Second Mortgage Made To Cover Down Payment
Estimated Equity
$168,547
Purchase Details
Closed on
Sep 19, 2006
Sold by
Cook David A and Cook Carol A
Bought by
Folger Andrew P and Folger Chere A
Home Financials for this Owner
Home Financials are based on the most recent Mortgage that was taken out on this home.
Original Mortgage
$84,800
Interest Rate
6.59%
Mortgage Type
Purchase Money Mortgage
Purchase Details
Closed on
Nov 13, 1986
Sold by
Molcsany Edward A
Bought by
Cook David A and Cook Carol A
Purchase Details
Closed on
Oct 23, 1981
Sold by
James A Dunson
Bought by
Molcsany Edward A
Purchase Details
Closed on
Jan 1, 1975
Bought by
Molshan Edward A
Create a Home Valuation Report for This Property
The Home Valuation Report is an in-depth analysis detailing your home's value as well as a comparison with similar homes in the area
Home Values in the Area
Average Home Value in this Area
Purchase History
| Date | Buyer | Sale Price | Title Company |
|---|---|---|---|
| Cron Jeremy K | $96,500 | Signature Title | |
| Folger Andrew P | $106,000 | City Title Agency | |
| Cook David A | $40,800 | -- | |
| Molcsany Edward A | $33,400 | -- | |
| Molshan Edward A | -- | -- |
Source: Public Records
Mortgage History
| Date | Status | Borrower | Loan Amount |
|---|---|---|---|
| Open | Cron Jeremy K | $2,895 | |
| Open | Cron Jeremy K | $95,009 | |
| Closed | Folger Andrew P | $84,800 |
Source: Public Records
Tax History Compared to Growth
Tax History
| Year | Tax Paid | Tax Assessment Tax Assessment Total Assessment is a certain percentage of the fair market value that is determined by local assessors to be the total taxable value of land and additions on the property. | Land | Improvement |
|---|---|---|---|---|
| 2024 | $2,753 | $42,000 | $8,610 | $33,390 |
| 2023 | $2,571 | $33,890 | $6,200 | $27,690 |
| 2022 | $2,556 | $33,880 | $6,195 | $27,685 |
| 2021 | $2,530 | $33,880 | $6,200 | $27,690 |
| 2020 | $2,268 | $26,250 | $4,800 | $21,460 |
| 2019 | $2,097 | $75,000 | $13,700 | $61,300 |
| 2018 | $2,093 | $26,250 | $4,800 | $21,460 |
| 2017 | $2,113 | $25,630 | $4,170 | $21,460 |
| 2016 | $2,097 | $25,630 | $4,170 | $21,460 |
| 2015 | $2,337 | $25,630 | $4,170 | $21,460 |
| 2014 | $2,337 | $28,460 | $4,620 | $23,840 |
Source: Public Records
Map
Nearby Homes
- 4248 W 58th St
- 4373 W 52nd St
- 4215 W 58th St
- 4464 W 53rd St
- 4484 W 53rd St
- 4456 W 49th St
- 4427 W 49th St
- 6706 Woodhaven Ave
- 6904 & 6908 Southfield Ave
- 4811 Ardmore Ave
- 7010 Woodhaven Ave
- 5000 Behrwald Ave
- 5105 Behrwald Ave
- 4098 W 57th St
- 4140 W 49th St
- 4510 Woburn Ave
- 6408 Dellbank Dr
- 4615 Ardmore Ave
- 7420 Outlook Ave
- 4109 W 50th St