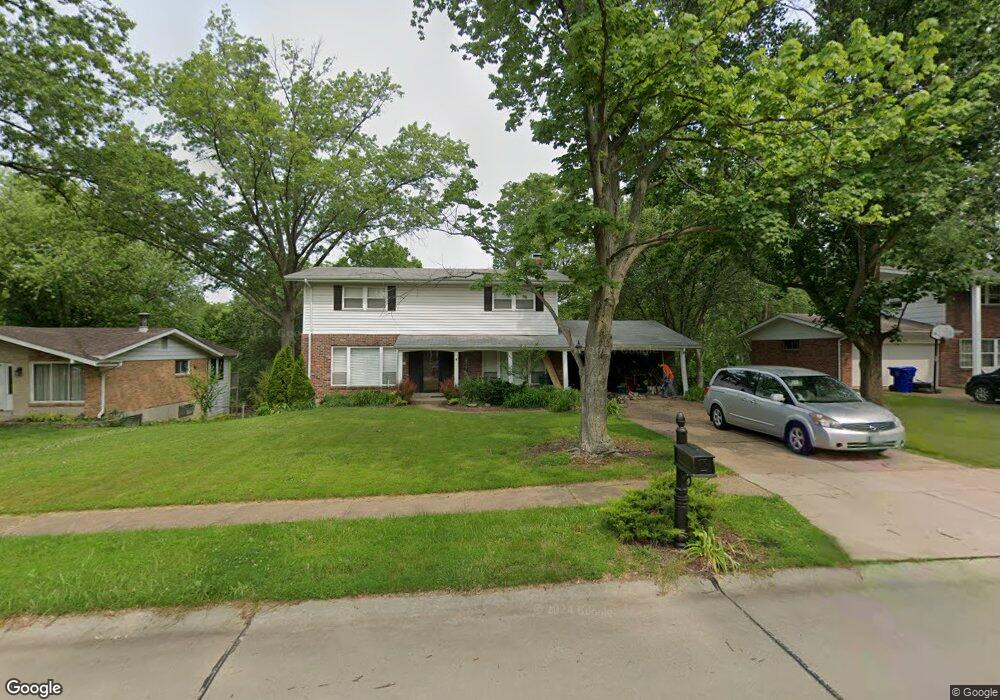
4359 Berrywick Terrace Saint Louis, MO 63128
Estimated Value: $388,000 - $399,850
4
Beds
3
Baths
1,872
Sq Ft
$212/Sq Ft
Est. Value
About This Home
This home is located at 4359 Berrywick Terrace, Saint Louis, MO 63128 and is currently estimated at $396,463, approximately $211 per square foot. 4359 Berrywick Terrace is a home located in St. Louis County with nearby schools including Sappington Elementary School, Sperreng Middle School, and Lindbergh High School.
Ownership History
Date
Name
Owned For
Owner Type
Purchase Details
Closed on
Mar 4, 2011
Sold by
Whitney David V and Whitney Rosaria S
Bought by
Whitney Whitney V and Whitney Rosaria S
Current Estimated Value
Home Financials for this Owner
Home Financials are based on the most recent Mortgage that was taken out on this home.
Original Mortgage
$173,460
Outstanding Balance
$118,847
Interest Rate
4.73%
Mortgage Type
Seller Take Back
Estimated Equity
$277,616
Purchase Details
Closed on
Oct 28, 2005
Sold by
Sime Mark L and Sime Mary Beth Clanahan
Bought by
Whitney David
Home Financials for this Owner
Home Financials are based on the most recent Mortgage that was taken out on this home.
Original Mortgage
$187,200
Interest Rate
5.75%
Mortgage Type
Fannie Mae Freddie Mac
Purchase Details
Closed on
Jun 8, 2004
Sold by
Sime Mary Beth Clanahan and Sime Mark L
Bought by
Sime Mark L and Sime Mary Beth Clanahan
Create a Home Valuation Report for This Property
The Home Valuation Report is an in-depth analysis detailing your home's value as well as a comparison with similar homes in the area
Home Values in the Area
Average Home Value in this Area
Purchase History
| Date | Buyer | Sale Price | Title Company |
|---|---|---|---|
| Whitney Whitney V | -- | Assured Title Company | |
| Whitney David | $234,000 | Clt | |
| Sime Mark L | -- | -- |
Source: Public Records
Mortgage History
| Date | Status | Borrower | Loan Amount |
|---|---|---|---|
| Open | Whitney Whitney V | $173,460 | |
| Closed | Whitney David | $187,200 |
Source: Public Records
Tax History Compared to Growth
Tax History
| Year | Tax Paid | Tax Assessment Tax Assessment Total Assessment is a certain percentage of the fair market value that is determined by local assessors to be the total taxable value of land and additions on the property. | Land | Improvement |
|---|---|---|---|---|
| 2025 | $3,940 | $62,150 | $25,990 | $36,160 |
| 2024 | $3,940 | $60,560 | $23,830 | $36,730 |
| 2023 | $3,930 | $60,560 | $23,830 | $36,730 |
| 2022 | $3,717 | $54,950 | $23,830 | $31,120 |
| 2021 | $3,585 | $54,950 | $23,830 | $31,120 |
| 2020 | $3,563 | $52,690 | $17,920 | $34,770 |
| 2019 | $3,554 | $52,690 | $17,920 | $34,770 |
| 2018 | $3,203 | $43,170 | $11,100 | $32,070 |
| 2017 | $3,169 | $43,170 | $11,100 | $32,070 |
| 2016 | $2,792 | $36,070 | $11,100 | $24,970 |
| 2015 | $2,749 | $36,070 | $11,100 | $24,970 |
| 2014 | $3,007 | $39,100 | $10,410 | $28,690 |
Source: Public Records
Map
Nearby Homes
- 4849 Gatesbury Dr
- 25 Fawnwood Dr
- 4740 Hedgemont Dr
- 4838 Dorsie Dr
- 4931 Theiss Rd
- 4449 Pinyon Jay Ct
- 4700 Theiss Rd
- 4829 Vermilion Dr
- 11862 E Concord Rd
- 5837 Oak Forest Ln
- 4642 Theiss Rd
- 11345 Revere Ln
- 4501 Eli Dr Unit I
- 4525 Eli Dr Unit D
- 12015 Charwick Dr
- 11673 Rossmoor Ln
- 12055 Charwick Dr
- 4334 Arrow Tree Dr Unit L
- 4334 Arrow Tree Dr Unit J
- 6910 Colonial Woods Dr Unit 95
- 4367 Berrywick Terrace
- 4351 Berrywick Terrace
- 4337 Berrywick Terrace
- 4375 Berrywick Terrace
- 4362 Berrywick Terrace
- 4325 Berrywick Terrace
- 4354 Berrywick Terrace
- 4370 Berrywick Terrace
- 4383 Berrywick Terrace
- 4340 Berrywick Terrace
- 4378 Berrywick Terrace
- 4317 Berrywick Terrace
- 4332 Berrywick Terrace
- 4391 Berrywick Terrace
- 18 Fawnwood Dr
- 19 Fawnwood Dr
- 19 Fawnwood Dr
- 4324 Berrywick Terrace
- 4807 Sunnyview Dr
- 17 Fawnwood Dr