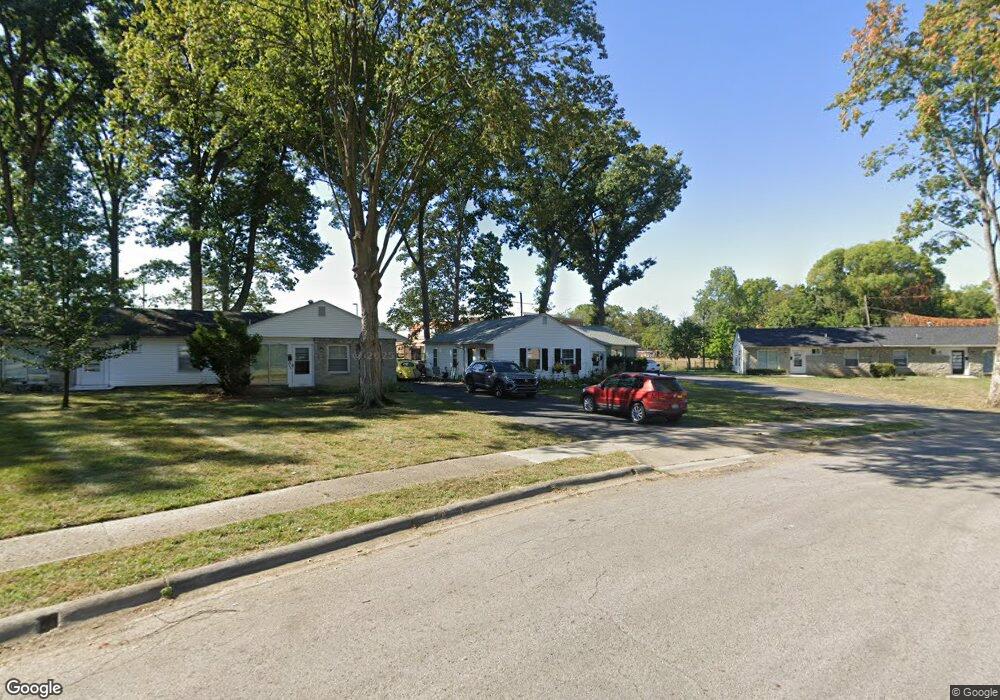
436 Beechtree Rd Unit 438 Columbus, OH 43213
Estimated Value: $180,000 - $233,000
6
Beds
2
Baths
1,750
Sq Ft
$122/Sq Ft
Est. Value
About This Home
This home is located at 436 Beechtree Rd Unit 438, Columbus, OH 43213 and is currently estimated at $212,930, approximately $121 per square foot. 436 Beechtree Rd Unit 438 is a home located in Franklin County with nearby schools including Beechwood Elementary School, Etna Road Elementary School, and Rosemore Middle School.
Create a Home Valuation Report for This Property
The Home Valuation Report is an in-depth analysis detailing your home's value as well as a comparison with similar homes in the area
Home Values in the Area
Average Home Value in this Area
Tax History
| Year | Tax Paid | Tax Assessment Tax Assessment Total Assessment is a certain percentage of the fair market value that is determined by local assessors to be the total taxable value of land and additions on the property. | Land | Improvement |
|---|---|---|---|---|
| 2025 | $2,601 | $33,430 | $17,150 | $16,280 |
| 2024 | $2,601 | $58,100 | $17,150 | $40,950 |
| 2023 | $2,583 | $58,100 | $17,150 | $40,950 |
| 2022 | $1,522 | $26,010 | $5,640 | $20,370 |
| 2021 | $1,431 | $26,010 | $5,640 | $20,370 |
| 2020 | $1,417 | $26,010 | $5,640 | $20,370 |
| 2019 | $1,417 | $22,610 | $4,900 | $17,710 |
| 2018 | $1,197 | $22,610 | $4,900 | $17,710 |
| 2017 | $1,205 | $22,610 | $4,900 | $17,710 |
| 2016 | $1,038 | $14,000 | $4,900 | $9,100 |
| 2015 | $949 | $14,000 | $4,900 | $9,100 |
| 2014 | $949 | $14,000 | $4,900 | $9,100 |
| 2013 | $451 | $14,000 | $4,900 | $9,100 |
Source: Public Records
Map
Nearby Homes
- 4105 Elbern Ave
- 4117 Elbern Ave
- 3840 Elbern Ave
- 4148 Elbern Ave
- 3814 Elbern Ave
- 320 Collingwood Ave
- 4212 Seigman Ave
- 3857 Doney St
- 4174 Wright Park
- 558 Maplewood Ave
- 91 Maplewood Ave
- 491 Westphal Ave
- 695 Erickson Ave
- 0 S Napoleon Ave
- 4481 Chandler Dr
- 798 S Yearling Rd
- 745 Pierce Ave
- 514 S Napoleon Ave
- 181 S Weyant Ave
- 4517 Saint Rita Ln
- 424 Beechtree Rd Unit 426
- 444 Beechtree Rd Unit 446
- 445 Beechtree Rd Unit 447
- 420 Beechtree Rd Unit 422
- 421 Beechtree Rd Unit 423
- 441 Beechtree Rd Unit 443
- 433 Beechtree Rd Unit 435
- 416 Beechtree Rd Unit 418
- 413 Beechtree Rd Unit 415
- 410 Beechtree Rd Unit 412
- 406 Beechtree Rd Unit 408
- 383 Beechtree Rd Unit 385
- 411 Mayflower Blvd
- 3985 Beechbank Rd Unit 987
- 3991 Beechbank Rd Unit 993
- 402 Beechtree Rd Unit 404
- 405 Mayflower Blvd
- 3979 Beechbank Rd Unit 981
- 399 Mayflower Blvd
- 3995 Beechbank Rd Unit 997
Your Personal Tour Guide
Ask me questions while you tour the home.