Estimated Value: $416,000 - $434,000
2
Beds
2
Baths
1,755
Sq Ft
$244/Sq Ft
Est. Value
About This Home
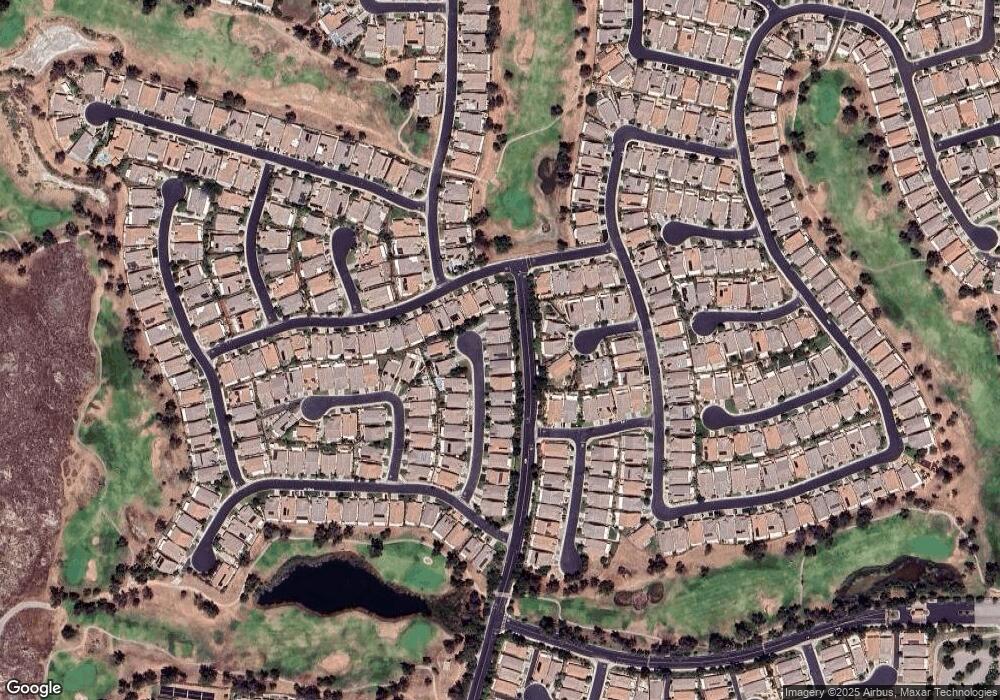
This home is located at 436 Bjorn Ct, Hemet, CA 92545 and is currently estimated at $428,108, approximately $243 per square foot. 436 Bjorn Ct is a home located in Riverside County with nearby schools including Cawston Elementary School, Rancho Viejo Middle School, and Tahquitz High School.
Ownership History
Date
Name
Owned For
Owner Type
Purchase Details
Closed on
Jul 9, 2025
Sold by
Mireles Jose De Jesus and Mireles Aracely April
Bought by
Mireles Family Trust and Mireles
Current Estimated Value
Purchase Details
Closed on
Oct 12, 2005
Sold by
Landreth Donald R and Landreth Elizabeth A
Bought by
Mireles Jose D and Mireles Aracely A
Home Financials for this Owner
Home Financials are based on the most recent Mortgage that was taken out on this home.
Original Mortgage
$217,750
Interest Rate
5.74%
Mortgage Type
Stand Alone First
Purchase Details
Closed on
May 5, 2004
Sold by
K Hovnanians Four Seasons At Hemet Llc
Bought by
Landreth Donald R and Landreth Elizabeth A
Home Financials for this Owner
Home Financials are based on the most recent Mortgage that was taken out on this home.
Original Mortgage
$206,350
Interest Rate
6.37%
Mortgage Type
Purchase Money Mortgage
Create a Home Valuation Report for This Property
The Home Valuation Report is an in-depth analysis detailing your home's value as well as a comparison with similar homes in the area
Home Values in the Area
Average Home Value in this Area
Purchase History
| Date | Buyer | Sale Price | Title Company |
|---|---|---|---|
| Mireles Family Trust | -- | None Listed On Document | |
| Mireles Jose De Jesus | -- | None Listed On Document | |
| Mireles Jose D | $325,000 | Fidelity National Title | |
| Landreth Donald R | $258,000 | First American Title Co |
Source: Public Records
Mortgage History
| Date | Status | Borrower | Loan Amount |
|---|---|---|---|
| Previous Owner | Mireles Jose D | $217,750 | |
| Previous Owner | Landreth Donald R | $206,350 |
Source: Public Records
Tax History Compared to Growth
Tax History
| Year | Tax Paid | Tax Assessment Tax Assessment Total Assessment is a certain percentage of the fair market value that is determined by local assessors to be the total taxable value of land and additions on the property. | Land | Improvement |
|---|---|---|---|---|
| 2025 | $4,075 | $444,116 | $95,647 | $348,469 |
| 2023 | $4,075 | $426,873 | $91,934 | $334,939 |
| 2022 | $5,456 | $393,564 | $84,942 | $308,622 |
| 2021 | $4,769 | $333,529 | $71,985 | $261,544 |
| 2020 | $4,340 | $297,794 | $64,272 | $233,522 |
| 2019 | $4,217 | $289,120 | $62,400 | $226,720 |
| 2018 | $4,035 | $278,000 | $60,000 | $218,000 |
| 2017 | $3,946 | $264,000 | $57,000 | $207,000 |
| 2016 | $3,728 | $244,000 | $53,000 | $191,000 |
| 2015 | $3,464 | $221,000 | $48,000 | $173,000 |
| 2014 | $3,154 | $203,000 | $44,000 | $159,000 |
Source: Public Records
Map
Nearby Homes
- 400 Bjorn Ct
- 8195 Faldo Ave
- 508 Casper Dr
- 465 Lyle Dr
- 570 Olazabal Dr
- 8120 Bay Hill Ave
- 268 Four Seasons Blvd
- 7704 Couples Way
- 8281 Triplett Ln
- 584 Tewell Dr
- 7816 Rawls Dr
- 8491 Maruyama Dr
- 270 Cog Hill Ln
- 7692 Dutra Dr
- 245 Glenview Ln
- 240 Glenview Ln
- 8197 Doral Ln
- 8217 Carnoustie Ave
- 8199 Carnoustie Ave
- 233 Eagle Ln
