Estimated Value: $128,000 - $176,000
4
Beds
2
Baths
1,523
Sq Ft
$98/Sq Ft
Est. Value
About This Home
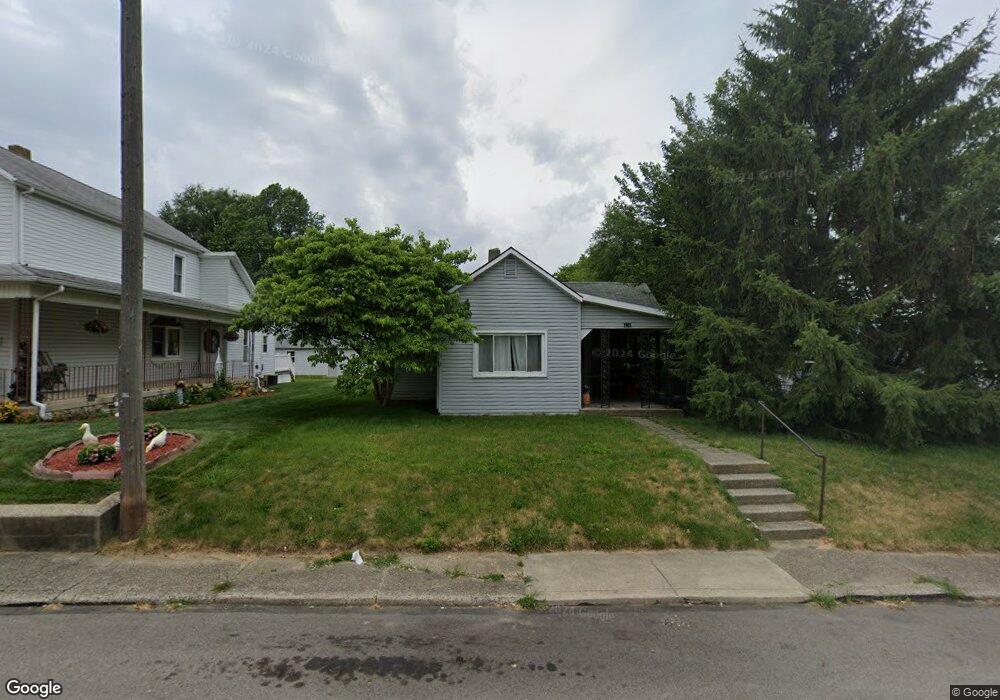
This home is located at 436 Brook St, Piqua, OH 45356 and is currently estimated at $149,339, approximately $98 per square foot. 436 Brook St is a home located in Miami County with nearby schools including Piqua Junior High School, Piqua High School, and Nicholas School.
Ownership History
Date
Name
Owned For
Owner Type
Purchase Details
Closed on
Jul 16, 2008
Sold by
Federal Home Loan Mortgage Corporation
Bought by
Delk John Allen
Current Estimated Value
Purchase Details
Closed on
Jun 5, 2007
Sold by
Francis Kristi
Bought by
Federal Home Loan Mortgage Corporation
Purchase Details
Closed on
Sep 27, 1999
Sold by
Jones Charles W and Jones Mary A
Bought by
Francis Kristi K
Home Financials for this Owner
Home Financials are based on the most recent Mortgage that was taken out on this home.
Original Mortgage
$48,885
Interest Rate
8.21%
Purchase Details
Closed on
Mar 1, 1984
Bought by
Jones Charles W
Create a Home Valuation Report for This Property
The Home Valuation Report is an in-depth analysis detailing your home's value as well as a comparison with similar homes in the area
Home Values in the Area
Average Home Value in this Area
Purchase History
| Date | Buyer | Sale Price | Title Company |
|---|---|---|---|
| Delk John Allen | -- | -- | |
| Federal Home Loan Mortgage Corporation | -- | -- | |
| Francis Kristi K | $47,500 | -- | |
| Jones Charles W | $25,500 | -- |
Source: Public Records
Mortgage History
| Date | Status | Borrower | Loan Amount |
|---|---|---|---|
| Previous Owner | Francis Kristi K | $48,885 |
Source: Public Records
Tax History Compared to Growth
Tax History
| Year | Tax Paid | Tax Assessment Tax Assessment Total Assessment is a certain percentage of the fair market value that is determined by local assessors to be the total taxable value of land and additions on the property. | Land | Improvement |
|---|---|---|---|---|
| 2024 | $1,060 | $25,800 | $6,860 | $18,940 |
| 2023 | $1,060 | $25,800 | $6,860 | $18,940 |
| 2022 | $1,079 | $25,800 | $6,860 | $18,940 |
| 2021 | $874 | $19,120 | $5,080 | $14,040 |
| 2020 | $857 | $19,120 | $5,080 | $14,040 |
| 2019 | $861 | $19,120 | $5,080 | $14,040 |
| 2018 | $826 | $17,500 | $5,110 | $12,390 |
| 2017 | $836 | $17,500 | $5,110 | $12,390 |
| 2016 | $827 | $17,500 | $5,110 | $12,390 |
| 2015 | $812 | $16,800 | $4,900 | $11,900 |
| 2014 | $812 | $16,800 | $4,900 | $11,900 |
| 2013 | $815 | $16,800 | $4,900 | $11,900 |
Source: Public Records
Map
Nearby Homes