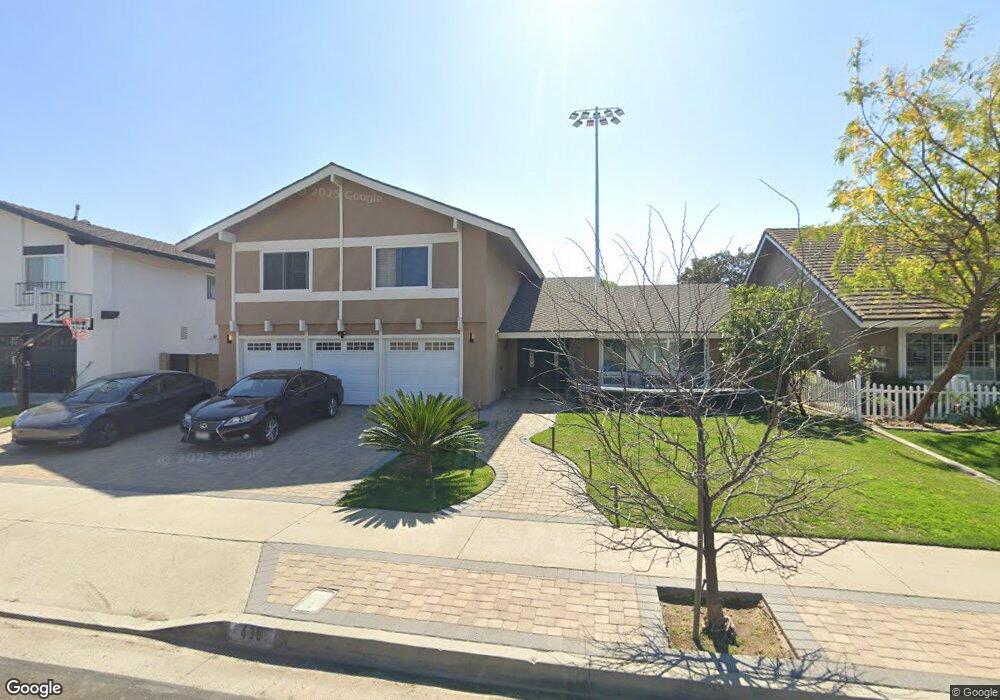
436 Brower Ave Placentia, CA 92870
Estimated Value: $1,320,000 - $1,433,000
4
Beds
3
Baths
2,509
Sq Ft
$548/Sq Ft
Est. Value
About This Home
This home is located at 436 Brower Ave, Placentia, CA 92870 and is currently estimated at $1,375,386, approximately $548 per square foot. 436 Brower Ave is a home located in Orange County with nearby schools including Brookhaven Elementary School, Col. J. K. Tuffree Middle School, and El Dorado High School.
Ownership History
Date
Name
Owned For
Owner Type
Purchase Details
Closed on
Jul 9, 2015
Sold by
Monroy Emmanuel F
Bought by
Monroy Emmanuel F and Monroy Elvira
Current Estimated Value
Home Financials for this Owner
Home Financials are based on the most recent Mortgage that was taken out on this home.
Original Mortgage
$486,285
Outstanding Balance
$189,495
Interest Rate
4.01%
Mortgage Type
New Conventional
Estimated Equity
$1,185,891
Purchase Details
Closed on
Aug 4, 2012
Sold by
Monroy Elvira and Monroy Emmanuel F
Bought by
Monroy Emmanuel F
Purchase Details
Closed on
Jun 28, 2007
Sold by
Bennett Aloysius L and Bennett Sabrina K
Bought by
Monroy Emmanuel F and Monroy Elvira
Home Financials for this Owner
Home Financials are based on the most recent Mortgage that was taken out on this home.
Original Mortgage
$560,000
Interest Rate
7%
Mortgage Type
New Conventional
Purchase Details
Closed on
Aug 2, 2004
Sold by
Evans Jeffrey J
Bought by
Bennett Aloysius L and Bennett Sabrina K
Home Financials for this Owner
Home Financials are based on the most recent Mortgage that was taken out on this home.
Original Mortgage
$552,000
Interest Rate
6.87%
Mortgage Type
Purchase Money Mortgage
Purchase Details
Closed on
Jul 20, 2001
Sold by
Hook Diane
Bought by
Evans Jeffrey J
Home Financials for this Owner
Home Financials are based on the most recent Mortgage that was taken out on this home.
Original Mortgage
$312,000
Interest Rate
9.75%
Purchase Details
Closed on
Jun 19, 2001
Sold by
Jackson Maureen P
Bought by
Evans Jeffrey J
Home Financials for this Owner
Home Financials are based on the most recent Mortgage that was taken out on this home.
Original Mortgage
$312,000
Interest Rate
9.75%
Purchase Details
Closed on
Jun 15, 2000
Sold by
Jackson R J
Bought by
Jackson Maureen P and Case #99D004831
Purchase Details
Closed on
Dec 19, 1997
Sold by
Jackson R and Maureen
Bought by
Jackson R J and Jackson Maureen P
Home Financials for this Owner
Home Financials are based on the most recent Mortgage that was taken out on this home.
Original Mortgage
$230,000
Interest Rate
7.22%
Purchase Details
Closed on
Jun 7, 1994
Sold by
Oberle Paul W and Oberle Janet M
Bought by
Jackson R J and Jackson Maureen P
Home Financials for this Owner
Home Financials are based on the most recent Mortgage that was taken out on this home.
Original Mortgage
$218,400
Interest Rate
8.38%
Create a Home Valuation Report for This Property
The Home Valuation Report is an in-depth analysis detailing your home's value as well as a comparison with similar homes in the area
Home Values in the Area
Average Home Value in this Area
Purchase History
| Date | Buyer | Sale Price | Title Company |
|---|---|---|---|
| Monroy Emmanuel F | -- | American Coast Title Company | |
| Monroy Emmanuel F | -- | None Available | |
| Monroy Emmanuel F | $700,000 | Multiple | |
| Bennett Aloysius L | $690,000 | Chicago Title Co | |
| Evans Jeffrey J | -- | Chicago Title Co | |
| Evans Jeffrey J | $390,000 | Chicago Title Co | |
| Jackson Maureen P | -- | -- | |
| Jackson R J | -- | Chicago Title Co | |
| Jackson R J | $273,000 | Orange Coast Title Company |
Source: Public Records
Mortgage History
| Date | Status | Borrower | Loan Amount |
|---|---|---|---|
| Open | Monroy Emmanuel F | $486,285 | |
| Previous Owner | Monroy Emmanuel F | $560,000 | |
| Previous Owner | Bennett Aloysius L | $552,000 | |
| Previous Owner | Evans Jeffrey J | $312,000 | |
| Previous Owner | Jackson R J | $230,000 | |
| Previous Owner | Jackson R J | $218,400 | |
| Closed | Evans Jeffrey J | $58,500 | |
| Closed | Bennett Aloysius L | $103,500 |
Source: Public Records
Tax History
| Year | Tax Paid | Tax Assessment Tax Assessment Total Assessment is a certain percentage of the fair market value that is determined by local assessors to be the total taxable value of land and additions on the property. | Land | Improvement |
|---|---|---|---|---|
| 2025 | $10,427 | $919,455 | $675,813 | $243,642 |
| 2024 | $10,427 | $901,427 | $662,562 | $238,865 |
| 2023 | $10,227 | $883,752 | $649,570 | $234,182 |
| 2022 | $10,106 | $866,424 | $636,833 | $229,591 |
| 2021 | $9,889 | $849,436 | $624,346 | $225,090 |
| 2020 | $9,920 | $840,727 | $617,945 | $222,782 |
| 2019 | $9,535 | $824,243 | $605,829 | $218,414 |
| 2018 | $9,088 | $778,000 | $582,304 | $195,696 |
| 2017 | $9,103 | $778,000 | $582,304 | $195,696 |
| 2016 | $7,977 | $676,000 | $490,505 | $185,495 |
| 2015 | $7,987 | $676,000 | $490,505 | $185,495 |
| 2014 | $7,900 | $676,000 | $490,505 | $185,495 |
Source: Public Records
Map
Nearby Homes
- 1837 Kelleher Place
- 1719 Pecos River
- 1525 Rogue St
- 1714 Kingston Rd
- 230 Gila Way
- 1410 Via Cortez
- 1714 Sierra Bonita Dr
- 455 Purdy Ave
- 320 Purdy Ave
- 237 Bagnall Ave
- 2317 Mohican Ave
- 5142 Hamer Ln
- 2123 Earnshaw Dr
- 1330 Limerick Dr
- 4582 Jeanean Ln
- 1261 Brian St
- 206 Allegheny Cir
- 1202 N Ventana Ln
- 3317 Topaz Ln
- 2232 California St
- 442 Brower Ave
- 430 Brower Ave
- 448 Brower Ave
- 424 Brower Ave
- 1806 Jones Place
- 1807 Macinnes Place
- 500 Brower Ave
- 418 Brower Ave
- 1807 Jones Place
- 1812 Jones Place
- 1813 Macinnes Place
- 1806 Macinnes Place
- 1813 Jones Place
- 506 Brower Ave
- 412 Brower Ave
- 1818 Jones Place
- 1806 Geeting Place
- 1819 Macinnes Place
- 1812 Macinnes Place
- 1812 Geeting Place
Your Personal Tour Guide
Ask me questions while you tour the home.