436 Cache Ct Vacaville, CA 95688
Estimated Value: $645,000 - $699,000
About This Home
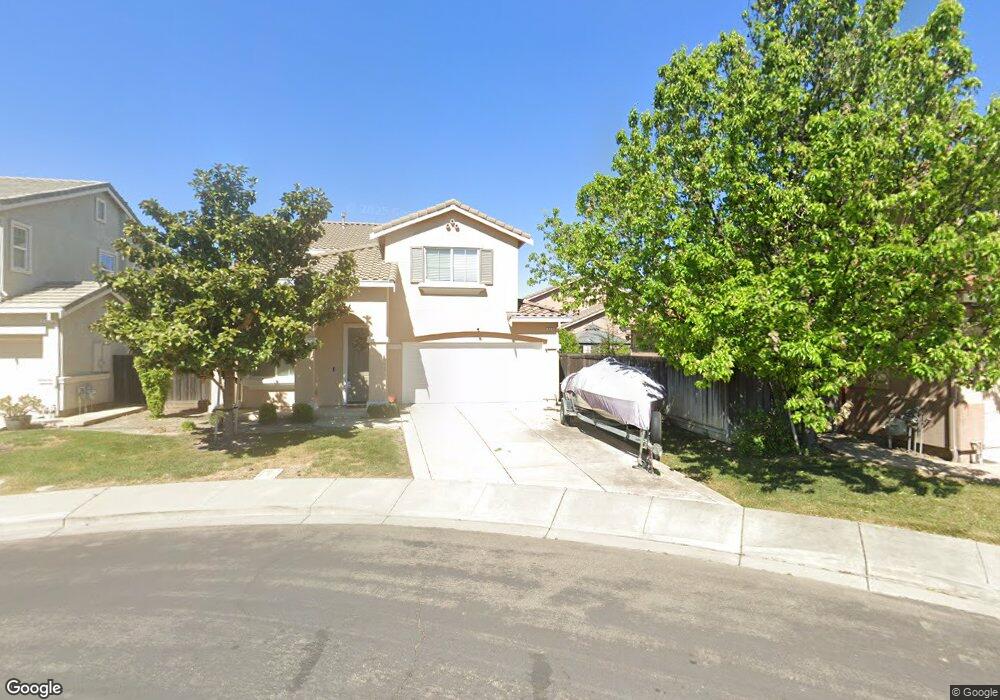
This home is located at 436 Cache Ct, Vacaville, CA 95688 and is currently estimated at $668,718, approximately $257 per square foot. 436 Cache Ct is a home with nearby schools including Edwin Markham Elementary School, Orchard Elementary School, and Willis Jepson Middle School.
Ownership History
We collect this data history from publicly available records. To have your information removed, we recommend requesting removal directly through your county’s website.
Purchase Details
Home Financials for this Owner
Home Financials are based on the most recent Mortgage that was taken out on this home.Purchase History
We collect this data history from publicly available records. To have your information removed, we recommend requesting removal directly through your county’s website.
| Date | Buyer | Sale Price | Title Company |
|---|---|---|---|
| $367,500 | Old Republic Title Company |
Mortgage History
We collect this data history from publicly available records. To have your information removed, we recommend requesting removal directly through your county’s website.
| Date | Status | Borrower | Loan Amount |
|---|---|---|---|
| Open | $293,900 |
Tax History
We collect this data history from publicly available records. To have your information removed, we recommend requesting removal directly through your county’s website.
| Year | Tax Paid | Tax Assessment Tax Assessment Total Assessment is a certain percentage of the fair market value that is determined by local assessors to be the total taxable value of land and additions on the property. | Land | Improvement |
|---|---|---|---|---|
| 2025 | $6,142 | $461,465 | $87,917 | $373,548 |
| 2024 | $6,142 | $452,418 | $86,194 | $366,224 |
| 2023 | $5,942 | $443,548 | $84,504 | $359,044 |
| 2022 | $5,805 | $434,852 | $82,849 | $352,003 |
| 2021 | $5,759 | $426,326 | $81,225 | $345,101 |
| 2020 | $5,880 | $421,956 | $80,393 | $341,563 |
| 2019 | $5,882 | $413,683 | $78,817 | $334,866 |
| 2018 | $5,858 | $405,572 | $77,272 | $328,300 |
| 2017 | $5,571 | $397,620 | $75,757 | $321,863 |
| 2016 | $5,511 | $389,824 | $74,272 | $315,552 |
| 2015 | $5,386 | $383,970 | $73,157 | $310,813 |
| 2014 | $5,100 | $376,449 | $71,724 | $304,725 |
Map
- 1157 N Station Dr
- 331 Frisbie Cir
- 754 Cannon Station Ct
- 243 Gannet St
- 3012 Merlin Ct
- 1043 Parkside Dr
- 724 Razorbill St
- 312 Rock Creek Cir
- 3370 Cotting Ln
- 6811 Willow Rd
- 5070 Walnut Rd
- 38 Del Rey Dr
- 5050 Melissa Ln
- 12 Del Rey Dr
- 144 Monterey Dr
- 976 Cashel Cir
- 360 Grand Canyon Dr
- 612 Pacific Grove Ct
- 367 Bartlett Ln
- 149 Lighthouse Way
- 442 Cache Ct
- 430 Cache Ct
- 621 Brazelton Cir
- 625 Brazelton Cir
- 617 Brazelton Cir
- 629 Brazelton Cir
- 418 Cache Ct
- 613 Brazelton Cir
- 633 Brazelton Cir
- 448 Cache Ct
- 454 Cache Ct
- 412 Cache Ct
- 609 Brazelton Cir
- 460 Cache Ct
- 466 Cache Ct
- 632 Brazelton Cir
- 637 Brazelton Cir
- 406 Cache Ct
- 472 Cache Ct
- 605 Brazelton Cir
Ask me questions while you tour the home.