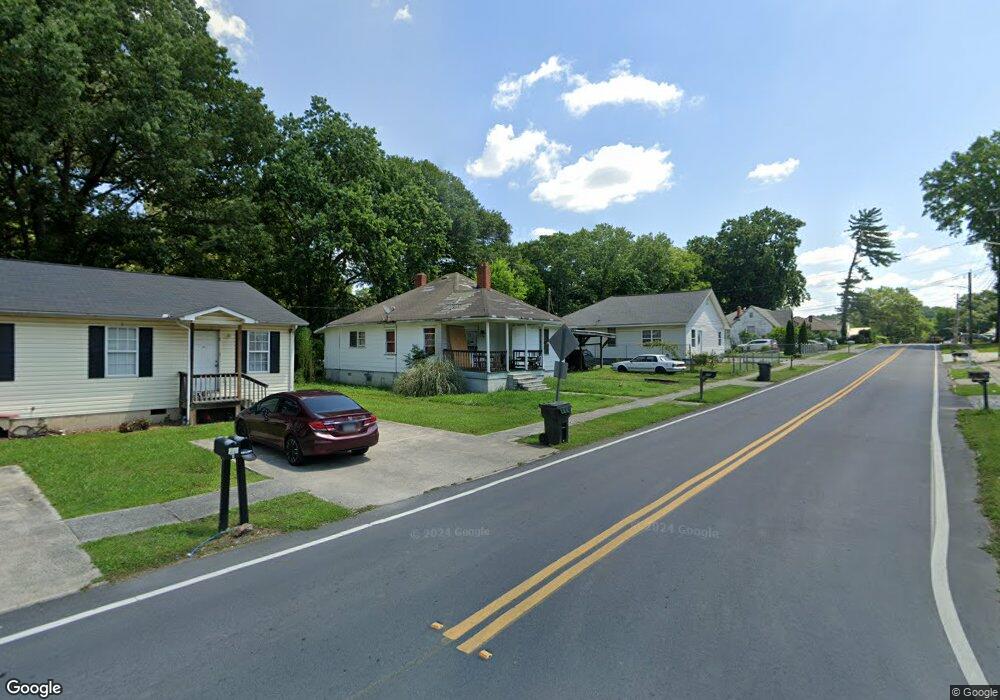
436 Cedar St Dalton, GA 30720
Estimated Value: $146,307 - $227,000
2
Beds
1
Bath
1,143
Sq Ft
$158/Sq Ft
Est. Value
About This Home
This home is located at 436 Cedar St, Dalton, GA 30720 and is currently estimated at $181,077, approximately $158 per square foot. 436 Cedar St is a home located in Whitfield County with nearby schools including Brookwood Elementary School, Dalton Middle School, and Dalton High School.
Ownership History
Date
Name
Owned For
Owner Type
Purchase Details
Closed on
Aug 31, 2011
Sold by
Anderson Elaine
Bought by
Anderson Elaine Beth
Current Estimated Value
Purchase Details
Closed on
Aug 15, 2011
Sold by
Federal National Mtg
Bought by
Self Help Ventures
Purchase Details
Closed on
Feb 1, 2011
Sold by
Suntrust Mtg Inc
Bought by
Federal National Mortgage Association
Purchase Details
Closed on
Dec 1, 2005
Sold by
Jones Wayne Edward
Bought by
Soto Sonia Elena
Purchase Details
Closed on
Jun 2, 2000
Sold by
Mauldin Ronald and Mauldin Patricia
Bought by
Jones Wayne Edward and Deborah Ann
Create a Home Valuation Report for This Property
The Home Valuation Report is an in-depth analysis detailing your home's value as well as a comparison with similar homes in the area
Home Values in the Area
Average Home Value in this Area
Purchase History
| Date | Buyer | Sale Price | Title Company |
|---|---|---|---|
| Anderson Elaine Beth | $90,800 | -- | |
| Self Help Ventures | -- | -- | |
| Federal National Mortgage Association | $100,883 | -- | |
| Suntrust Mtg Inc | $100,883 | -- | |
| Soto Sonia Elena | -- | -- | |
| Jones Wayne Edward | $75,000 | -- |
Source: Public Records
Tax History Compared to Growth
Tax History
| Year | Tax Paid | Tax Assessment Tax Assessment Total Assessment is a certain percentage of the fair market value that is determined by local assessors to be the total taxable value of land and additions on the property. | Land | Improvement |
|---|---|---|---|---|
| 2024 | $1,447 | $47,990 | $7,600 | $40,390 |
| 2023 | $1,447 | $39,072 | $7,200 | $31,872 |
| 2022 | $868 | $32,592 | $8,400 | $24,192 |
| 2021 | $869 | $32,592 | $8,400 | $24,192 |
| 2020 | $891 | $32,592 | $8,400 | $24,192 |
| 2019 | $984 | $34,463 | $8,400 | $26,063 |
| 2018 | $700 | $26,644 | $8,400 | $18,244 |
| 2017 | $668 | $26,644 | $8,400 | $18,244 |
| 2016 | $453 | $20,688 | $4,095 | $16,593 |
| 2014 | $689 | $27,800 | $4,095 | $23,704 |
| 2013 | -- | $27,799 | $4,095 | $23,704 |
Source: Public Records
Map
Nearby Homes