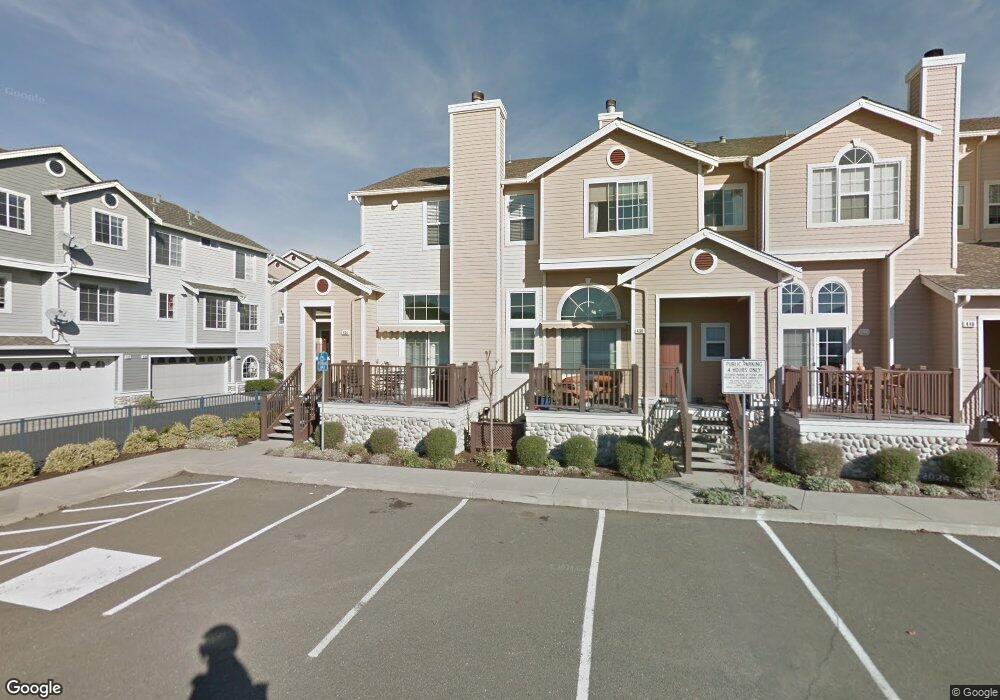
436 E E St Benicia, CA 94510
Estimated Value: $641,000 - $798,000
3
Beds
3
Baths
1,640
Sq Ft
$429/Sq Ft
Est. Value
About This Home
This home is located at 436 E E St, Benicia, CA 94510 and is currently estimated at $703,838, approximately $429 per square foot. 436 E E St is a home located in Solano County with nearby schools including Mary Farmar Elementary School, Benicia Middle School, and Benicia High School.
Ownership History
Date
Name
Owned For
Owner Type
Purchase Details
Closed on
Nov 8, 2019
Sold by
Halloran Alicia E and Alicia E Halloran Trust
Bought by
Halloran Alicia Schindel and Alicia Schindel Halloran Trus
Current Estimated Value
Purchase Details
Closed on
Oct 14, 2014
Sold by
Halloran James F
Bought by
Halloran Alicia E
Purchase Details
Closed on
Oct 13, 2014
Sold by
Rice Donald L
Bought by
Halloran Alicia E
Purchase Details
Closed on
Apr 23, 2010
Sold by
Kullenberg Effie Adele
Bought by
Rice Donald L
Purchase Details
Closed on
Apr 22, 1999
Sold by
Kaufman & Broad Of Northern Ca Inc
Bought by
Kullenberg Frederic Wayne and Kullenberg Effie Adele
Home Financials for this Owner
Home Financials are based on the most recent Mortgage that was taken out on this home.
Original Mortgage
$200,000
Interest Rate
6.62%
Create a Home Valuation Report for This Property
The Home Valuation Report is an in-depth analysis detailing your home's value as well as a comparison with similar homes in the area
Purchase History
| Date | Buyer | Sale Price | Title Company |
|---|---|---|---|
| Halloran Alicia Schindel | -- | None Available | |
| Halloran Alicia E | -- | North American Title Co Inc | |
| Halloran Alicia E | $475,000 | North American Title Co Inc | |
| Rice Donald L | $265,000 | North American Title Company | |
| Kullenberg Frederic Wayne | $289,500 | First American Title |
Source: Public Records
Mortgage History
| Date | Status | Borrower | Loan Amount |
|---|---|---|---|
| Previous Owner | Kullenberg Frederic Wayne | $200,000 |
Source: Public Records
Tax History
| Year | Tax Paid | Tax Assessment Tax Assessment Total Assessment is a certain percentage of the fair market value that is determined by local assessors to be the total taxable value of land and additions on the property. | Land | Improvement |
|---|---|---|---|---|
| 2025 | $6,693 | $570,867 | $150,226 | $420,641 |
| 2024 | $6,693 | $559,675 | $147,281 | $412,394 |
| 2023 | $6,532 | $548,702 | $144,394 | $404,308 |
| 2022 | $6,411 | $537,944 | $141,563 | $396,381 |
| 2021 | $6,280 | $527,397 | $138,788 | $388,609 |
| 2020 | $6,197 | $521,990 | $137,365 | $384,625 |
| 2019 | $6,089 | $511,756 | $134,672 | $377,084 |
| 2018 | $5,934 | $501,723 | $132,032 | $369,691 |
| 2017 | $5,797 | $491,887 | $129,444 | $362,443 |
| 2016 | $5,846 | $482,243 | $126,906 | $355,337 |
| 2015 | $5,698 | $475,000 | $125,000 | $350,000 |
| 2014 | $3,374 | $279,044 | $52,651 | $226,393 |
Source: Public Records
Map
Nearby Homes
Your Personal Tour Guide
Ask me questions while you tour the home.