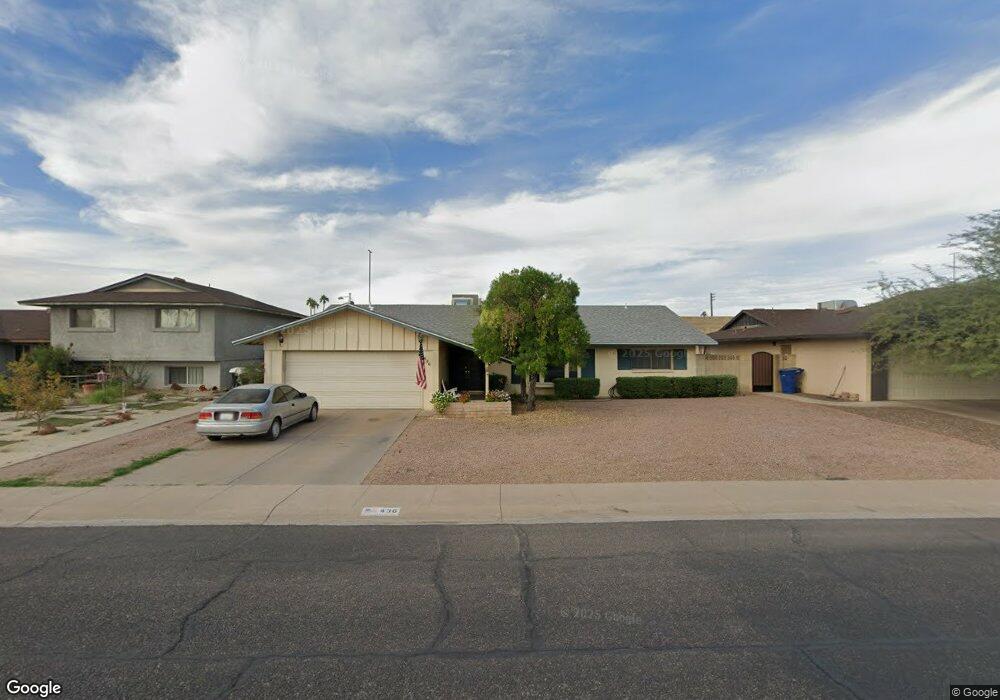
436 E Greenway Dr Tempe, AZ 85282
The Lakes NeighborhoodEstimated Value: $382,799 - $523,000
Studio
2
Baths
1,852
Sq Ft
$254/Sq Ft
Est. Value
About This Home
This home is located at 436 E Greenway Dr, Tempe, AZ 85282 and is currently estimated at $470,450, approximately $254 per square foot. 436 E Greenway Dr is a home located in Maricopa County with nearby schools including Arredondo Elementary School, Connolly Middle School, and Tempe High School.
Ownership History
Date
Name
Owned For
Owner Type
Purchase Details
Closed on
May 24, 2022
Sold by
Robenalt Christopher A
Bought by
Robenalt Christopher A
Current Estimated Value
Home Financials for this Owner
Home Financials are based on the most recent Mortgage that was taken out on this home.
Original Mortgage
$230,000
Outstanding Balance
$218,495
Interest Rate
5.25%
Mortgage Type
New Conventional
Estimated Equity
$251,955
Purchase Details
Closed on
Apr 17, 2002
Sold by
Casteel Harold and Casteel Geraldine
Bought by
Robenalt Christopher A
Purchase Details
Closed on
Mar 26, 2002
Sold by
Robenalt Wendy
Bought by
Robenalt Christopher A
Purchase Details
Closed on
Oct 22, 1996
Sold by
Sargeant Robert B
Bought by
Casteel Harold and Casteel Geraldine
Create a Home Valuation Report for This Property
The Home Valuation Report is an in-depth analysis detailing your home's value as well as a comparison with similar homes in the area
Home Values in the Area
Average Home Value in this Area
Purchase History
| Date | Buyer | Sale Price | Title Company |
|---|---|---|---|
| Robenalt Christopher A | -- | New Title Company Name | |
| Robenalt Christopher A | $148,000 | Capital Title Agency Inc | |
| Robenalt Christopher A | -- | Capital Title Agency Inc | |
| Casteel Harold | $98,000 | Chicago Title Insurance Co |
Source: Public Records
Mortgage History
| Date | Status | Borrower | Loan Amount |
|---|---|---|---|
| Open | Robenalt Christopher A | $230,000 |
Source: Public Records
Tax History
| Year | Tax Paid | Tax Assessment Tax Assessment Total Assessment is a certain percentage of the fair market value that is determined by local assessors to be the total taxable value of land and additions on the property. | Land | Improvement |
|---|---|---|---|---|
| 2025 | $1,922 | $18,438 | -- | -- |
| 2024 | $1,764 | $17,560 | -- | -- |
| 2023 | $1,764 | $35,170 | $7,030 | $28,140 |
| 2022 | $1,684 | $26,020 | $5,200 | $20,820 |
| 2021 | $1,718 | $24,070 | $4,810 | $19,260 |
| 2020 | $1,660 | $22,480 | $4,490 | $17,990 |
| 2019 | $1,629 | $20,070 | $4,010 | $16,060 |
| 2018 | $1,585 | $18,510 | $3,700 | $14,810 |
| 2017 | $1,535 | $16,860 | $3,370 | $13,490 |
| 2016 | $1,528 | $16,930 | $3,380 | $13,550 |
| 2015 | $1,478 | $15,010 | $3,000 | $12,010 |
Source: Public Records
Map
Nearby Homes
- 516 E Greenway Dr
- 506 E Ellis Dr
- 4517 S Grandview Ave
- 4617 S Grandview Ave
- 534 E Pebble Beach Dr
- 644 E La Jolla Dr
- 206 E Manhatton Dr
- 122 E Hermosa Dr
- 735 E Manhatton Dr
- 650 E Malibu Dr
- 14 E Hermosa Dr Unit 47
- 928 E La Jolla Dr
- 406 E Colgate Dr
- 942 E Laguna Dr
- 3224 S El Camino Dr
- 5308 S La Rosa Dr
- 4414 S Terrace Rd
- 1032 E Laguna Dr
- 4526 S Terrace Rd
- 200 E Southern Ave Unit 160
- 442 E Greenway Dr
- 430 E Greenway Dr
- 0000 W Xxxxxxxxxxxx Dr
- 504 E Greenway Dr
- 426 E Greenway Dr
- 4402 S Ventura Dr
- 429 E Greenway Dr
- 510 E Greenway Dr
- 420 E Greenway Dr
- 4408 S Ventura Dr
- 4403 S Ventura Dr
- 425 E Greenway Dr
- 416 E Greenway Dr
- 417 E Greenway Dr
- 4409 S Ventura Dr
- 421 E Greenway Dr
- 000 S 000 St
- 4404 S Mcallister Ave
- 522 E Greenway Dr
- 410 E Greenway Dr
Your Personal Tour Guide
Ask me questions while you tour the home.