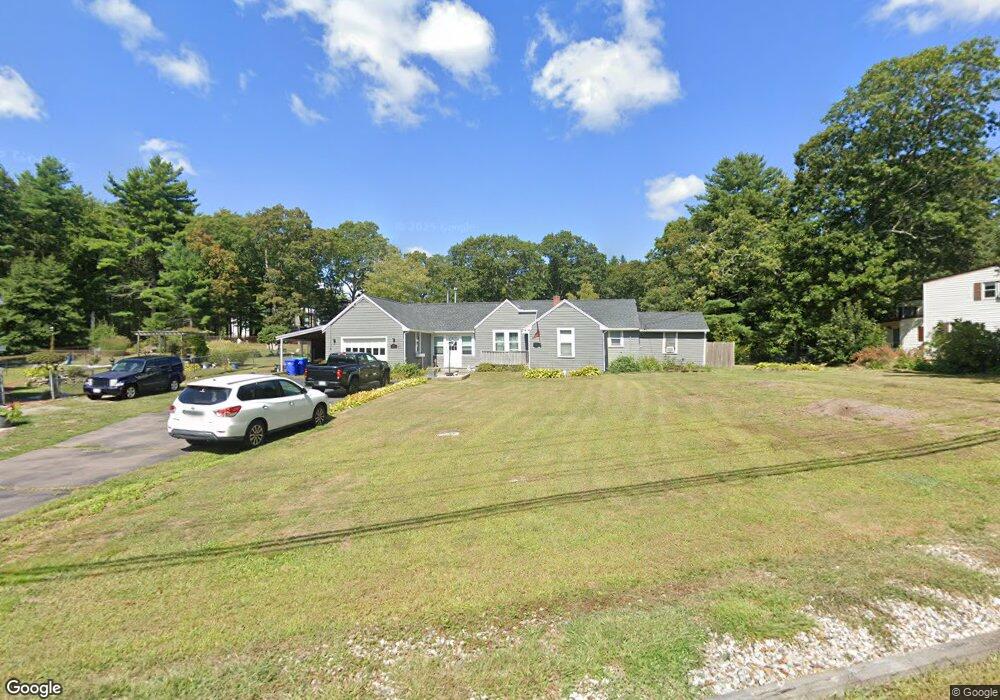
436 Forest St Rockland, MA 02370
Estimated Value: $378,000 - $525,000
2
Beds
1
Bath
1,035
Sq Ft
$448/Sq Ft
Est. Value
About This Home
This home is located at 436 Forest St, Rockland, MA 02370 and is currently estimated at $463,788, approximately $448 per square foot. 436 Forest St is a home located in Plymouth County with nearby schools including Rockland Senior High School, Calvary Chapel Academy, and Holy Family Elementary School.
Ownership History
Date
Name
Owned For
Owner Type
Purchase Details
Closed on
Jun 16, 2017
Sold by
Greene Rt
Bought by
Naughton Josh J
Current Estimated Value
Home Financials for this Owner
Home Financials are based on the most recent Mortgage that was taken out on this home.
Original Mortgage
$181,550
Outstanding Balance
$151,012
Interest Rate
4.02%
Mortgage Type
FHA
Estimated Equity
$312,776
Create a Home Valuation Report for This Property
The Home Valuation Report is an in-depth analysis detailing your home's value as well as a comparison with similar homes in the area
Home Values in the Area
Average Home Value in this Area
Purchase History
| Date | Buyer | Sale Price | Title Company |
|---|---|---|---|
| Naughton Josh J | $184,900 | -- |
Source: Public Records
Mortgage History
| Date | Status | Borrower | Loan Amount |
|---|---|---|---|
| Open | Naughton Josh J | $181,550 |
Source: Public Records
Tax History Compared to Growth
Tax History
| Year | Tax Paid | Tax Assessment Tax Assessment Total Assessment is a certain percentage of the fair market value that is determined by local assessors to be the total taxable value of land and additions on the property. | Land | Improvement |
|---|---|---|---|---|
| 2025 | $6,064 | $443,600 | $232,200 | $211,400 |
| 2024 | $5,886 | $418,600 | $219,100 | $199,500 |
| 2023 | $6,006 | $394,600 | $211,400 | $183,200 |
| 2022 | $5,749 | $343,200 | $183,800 | $159,400 |
| 2021 | $5,312 | $307,400 | $167,100 | $140,300 |
| 2020 | $5,124 | $292,800 | $159,200 | $133,600 |
| 2019 | $5,001 | $279,100 | $151,600 | $127,500 |
| 2018 | $8,564 | $256,400 | $151,600 | $104,800 |
| 2017 | $4,566 | $247,100 | $151,600 | $95,500 |
| 2016 | $4,395 | $237,700 | $145,800 | $91,900 |
| 2015 | $4,185 | $219,900 | $136,300 | $83,600 |
| 2014 | $3,954 | $215,600 | $133,600 | $82,000 |
Source: Public Records
Map
Nearby Homes
- 65 Boxberry Ln
- 7 Boxberry Ln Unit 7
- 18 Midfield Dr
- 141 Deerfield Ln
- 120 Deerfield Ln
- 206-208 Hinghm St
- 775 Union St
- 737-739 Union St
- 55 Turner Rd
- 35-37 Salem St
- 83 Summit St
- 18 Colby St
- 540 Union St
- 79 Tilden Rd
- 10 Horn Beam St Unit 299
- 3 Blueberry Ct
- 507 Liberty St
- 94 Leisurewoods Dr
- 86 Leisurewoods Dr Unit 279
- 5 Juniper Cir