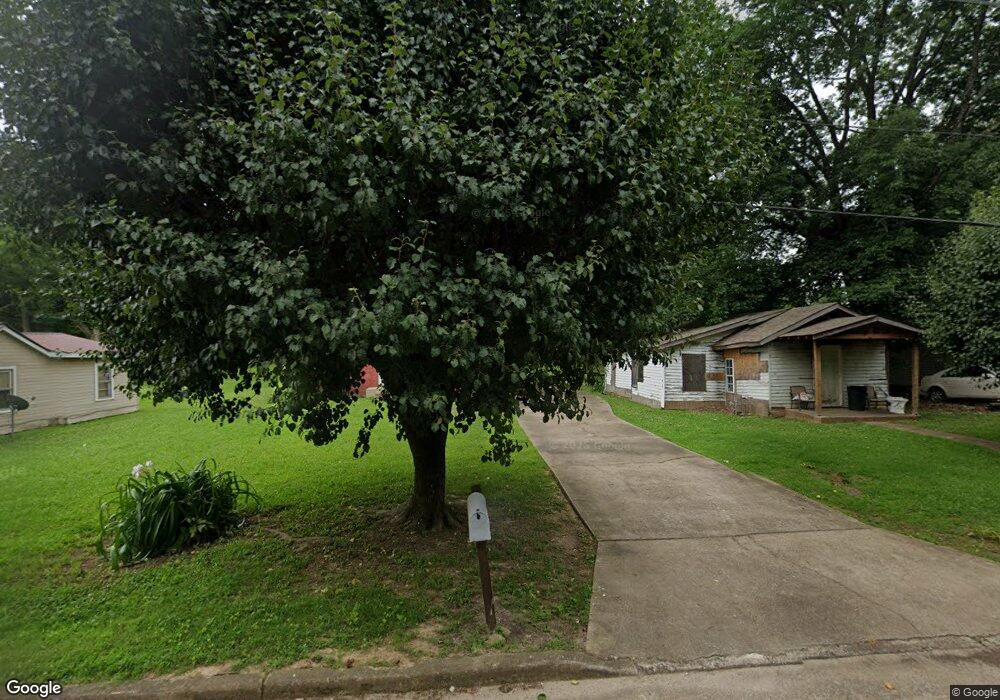
436 Fourth St Unit 440 Henderson, TN 38340
Estimated Value: $98,000 - $159,000
--
Bed
1
Bath
1,024
Sq Ft
$123/Sq Ft
Est. Value
About This Home
This home is located at 436 Fourth St Unit 440, Henderson, TN 38340 and is currently estimated at $126,224, approximately $123 per square foot. 436 Fourth St Unit 440 is a home located in Chester County with nearby schools including Chester County High School and Miracle Temple Christian Academy.
Ownership History
Date
Name
Owned For
Owner Type
Purchase Details
Closed on
Jul 21, 2022
Sold by
Jennifer Mickens
Bought by
Flowers Sylvia
Current Estimated Value
Home Financials for this Owner
Home Financials are based on the most recent Mortgage that was taken out on this home.
Original Mortgage
$26,611
Outstanding Balance
$13,505
Interest Rate
5.81%
Mortgage Type
Credit Line Revolving
Estimated Equity
$112,719
Purchase Details
Closed on
Nov 15, 2017
Sold by
Williams Gabe
Bought by
Flowers Sylvia
Home Financials for this Owner
Home Financials are based on the most recent Mortgage that was taken out on this home.
Original Mortgage
$36,079
Interest Rate
3.88%
Mortgage Type
New Conventional
Purchase Details
Closed on
Apr 12, 2013
Sold by
Flowers Sylvia Brown
Bought by
Williams Gabe
Purchase Details
Closed on
Sep 17, 2008
Sold by
Flowers Sylvia B
Bought by
Flowers Marles T
Create a Home Valuation Report for This Property
The Home Valuation Report is an in-depth analysis detailing your home's value as well as a comparison with similar homes in the area
Home Values in the Area
Average Home Value in this Area
Purchase History
| Date | Buyer | Sale Price | Title Company |
|---|---|---|---|
| Flowers Sylvia | -- | Johnson Jay J | |
| Flowers Sylvia | -- | None Listed On Document | |
| Flowers Sylvia | $41,500 | -- | |
| Williams Gabe | $19,900 | -- | |
| Flowers Marles T | -- | -- |
Source: Public Records
Mortgage History
| Date | Status | Borrower | Loan Amount |
|---|---|---|---|
| Open | Flowers Sylvia | $26,611 | |
| Closed | Flowers Sylvia | $26,611 | |
| Previous Owner | Flowers Sylvia | $36,079 |
Source: Public Records
Tax History Compared to Growth
Tax History
| Year | Tax Paid | Tax Assessment Tax Assessment Total Assessment is a certain percentage of the fair market value that is determined by local assessors to be the total taxable value of land and additions on the property. | Land | Improvement |
|---|---|---|---|---|
| 2025 | $376 | $18,475 | $0 | $0 |
| 2024 | $400 | $10,225 | $0 | $0 |
| 2023 | $254 | $10,225 | $0 | $0 |
| 2022 | $292 | $10,225 | $0 | $0 |
| 2021 | $420 | $9,500 | $0 | $0 |
| 2020 | $336 | $9,500 | $0 | $0 |
| 2019 | $336 | $9,500 | $0 | $0 |
| 2018 | $216 | $6,125 | $0 | $0 |
| 2017 | $216 | $6,125 | $0 | $0 |
| 2014 | $309 | $8,262 | $0 | $0 |
Source: Public Records
Map
Nearby Homes
- 457 Kendyl Cove
- 447 Mifflin Ave
- 259 E 3rd St
- 251 E Third St
- 661 Mifflin Ave
- 0 Hill Ave
- 225 E Third St
- 467 White Ave
- 316 Meadow Brook Dr
- 511 White Ave
- 308 Meadow Brook Dr
- 535 White Ave
- 757 Christi Loop
- 513 Crook Ave
- 263 North Ave
- 164 Ben Cove
- 533 North Ave
- 135 W Third St
- 137 Gibson Dr
- Lot 5 Greystone Cove