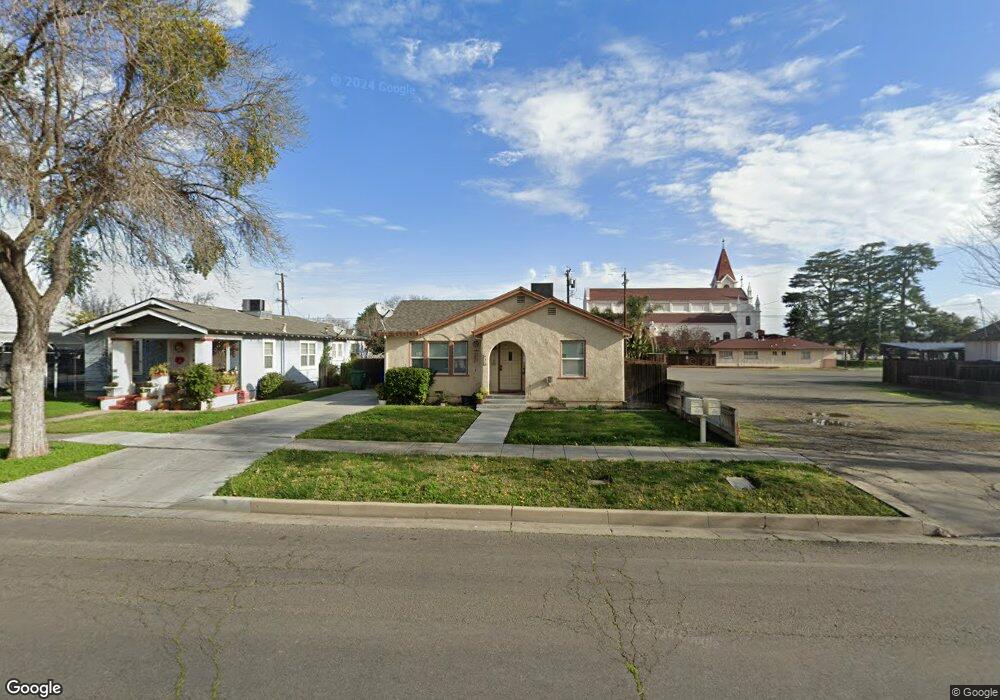
436 L St Los Banos, CA 93635
Estimated Value: $218,000 - $390,000
3
Beds
1
Bath
1,288
Sq Ft
$229/Sq Ft
Est. Value
About This Home
This home is located at 436 L St, Los Banos, CA 93635 and is currently estimated at $294,600, approximately $228 per square foot. 436 L St is a home located in Merced County with nearby schools including Los Banos Elementary School, Creekside Junior High School, and Los Banos High School.
Ownership History
Date
Name
Owned For
Owner Type
Purchase Details
Closed on
Jun 5, 2007
Sold by
Young Richard H and Young Gina L
Bought by
Young Richard Henry and Young Gina Louise
Current Estimated Value
Purchase Details
Closed on
Feb 8, 2005
Sold by
Young Charles T and Young Debbie L
Bought by
Young Charles T and Young Debbie L
Purchase Details
Closed on
Oct 27, 2004
Sold by
Young Charles and Young Debbie
Bought by
Young Charles T and Young Debbie L
Purchase Details
Closed on
Oct 14, 2003
Sold by
Germino Donald O and The James H Pricolo 1998 Trust
Bought by
Young Charles and Young Debbie
Create a Home Valuation Report for This Property
The Home Valuation Report is an in-depth analysis detailing your home's value as well as a comparison with similar homes in the area
Home Values in the Area
Average Home Value in this Area
Purchase History
| Date | Buyer | Sale Price | Title Company |
|---|---|---|---|
| Young Richard Henry | -- | None Available | |
| Young Charles T | -- | -- | |
| Young Charles T | -- | -- | |
| Young Charles | $66,000 | Fidelity Title Company |
Source: Public Records
Tax History Compared to Growth
Tax History
| Year | Tax Paid | Tax Assessment Tax Assessment Total Assessment is a certain percentage of the fair market value that is determined by local assessors to be the total taxable value of land and additions on the property. | Land | Improvement |
|---|---|---|---|---|
| 2025 | $2,040 | $184,016 | $93,827 | $90,189 |
| 2024 | $2,040 | $180,409 | $91,988 | $88,421 |
| 2023 | $1,927 | $176,873 | $90,185 | $86,688 |
| 2022 | $1,899 | $173,406 | $88,417 | $84,989 |
| 2021 | $1,881 | $170,007 | $86,684 | $83,323 |
| 2020 | $1,860 | $168,265 | $85,796 | $82,469 |
| 2019 | $1,827 | $164,966 | $84,114 | $80,852 |
| 2018 | $1,773 | $161,732 | $82,465 | $79,267 |
| 2017 | $1,752 | $158,562 | $80,849 | $77,713 |
| 2016 | $1,773 | $155,454 | $79,264 | $76,190 |
| 2015 | $1,736 | $153,120 | $78,074 | $75,046 |
| 2014 | $1,452 | $129,000 | $25,000 | $104,000 |
Source: Public Records
Map
Nearby Homes