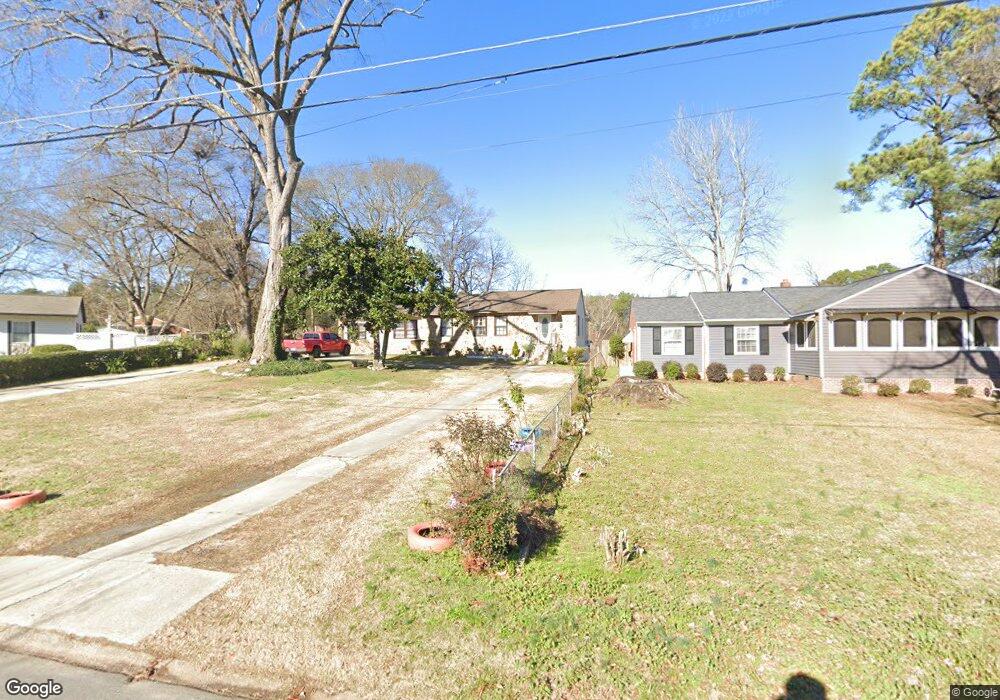
436 Lansing St Raleigh, NC 27610
Longacres NeighborhoodEstimated Value: $287,000 - $403,000
3
Beds
2
Baths
1,588
Sq Ft
$206/Sq Ft
Est. Value
About This Home
This home is located at 436 Lansing St, Raleigh, NC 27610 and is currently estimated at $327,157, approximately $206 per square foot. 436 Lansing St is a home located in Wake County with nearby schools including Poe Elementary School, Moore Square Museum Magnet Middle School, and Broughton Magnet High School.
Ownership History
Date
Name
Owned For
Owner Type
Purchase Details
Closed on
Nov 30, 2012
Sold by
Hyman Ronnie and Hyman Betty F
Bought by
Midio Reyes Flores
Current Estimated Value
Home Financials for this Owner
Home Financials are based on the most recent Mortgage that was taken out on this home.
Original Mortgage
$80,750
Outstanding Balance
$56,026
Interest Rate
3.4%
Mortgage Type
New Conventional
Estimated Equity
$271,131
Create a Home Valuation Report for This Property
The Home Valuation Report is an in-depth analysis detailing your home's value as well as a comparison with similar homes in the area
Home Values in the Area
Average Home Value in this Area
Purchase History
| Date | Buyer | Sale Price | Title Company |
|---|---|---|---|
| Midio Reyes Flores | $85,000 | None Available |
Source: Public Records
Mortgage History
| Date | Status | Borrower | Loan Amount |
|---|---|---|---|
| Open | Midio Reyes Flores | $80,750 |
Source: Public Records
Tax History Compared to Growth
Tax History
| Year | Tax Paid | Tax Assessment Tax Assessment Total Assessment is a certain percentage of the fair market value that is determined by local assessors to be the total taxable value of land and additions on the property. | Land | Improvement |
|---|---|---|---|---|
| 2025 | $2,237 | $254,234 | $130,000 | $124,234 |
| 2024 | $2,228 | $254,234 | $130,000 | $124,234 |
| 2023 | $1,639 | $148,563 | $60,000 | $88,563 |
| 2022 | $1,524 | $148,563 | $60,000 | $88,563 |
| 2021 | $1,466 | $148,563 | $60,000 | $88,563 |
| 2020 | $1,439 | $148,563 | $60,000 | $88,563 |
| 2019 | $1,120 | $94,947 | $28,000 | $66,947 |
| 2018 | $1,057 | $94,947 | $28,000 | $66,947 |
| 2017 | $1,008 | $94,947 | $28,000 | $66,947 |
| 2016 | $987 | $94,947 | $28,000 | $66,947 |
| 2015 | $1,025 | $97,007 | $28,000 | $69,007 |
| 2014 | $972 | $97,007 | $28,000 | $69,007 |
Source: Public Records
Map
Nearby Homes
- 510 Lansing St
- 2304 Nelson St
- 2312 Shannon St
- 2316 Shannon St
- 413 Solar Dr
- 501 Solar Dr
- 500 Sherrybrook Dr
- 1529 Battery Dr
- 333 Merrywood Dr
- 1501 Beauty Ave
- 123 Star St
- 1611 Poole Rd
- 1422 Joe Louis Ave
- 1418 Joe Louis Ave
- 720 Sherrybrook Dr
- 125 Lord Ashley Rd
- 100 Farris Ct
- 1116 E Martin St
- 816 Peyton St
- 1124 Upchurch St
- 432 Lansing St
- 2113 Ramseur St
- 2109 Ramseur St
- 428 Lansing St
- 445 Parnell Dr
- 441 Parnell Dr
- 449 Parnell Dr
- 2200 Shannon St
- 424 Lansing St
- 437 Parnell Dr
- 2105 Ramseur St
- 453 Parnell Dr
- 433 Parnell Dr
- 2112 Ramseur St
- 425 Lansing St
- 420 Lansing St
- 2204 Shannon St
- 501 Lansing St
- 2108 Ramseur St
- 429 Parnell Dr