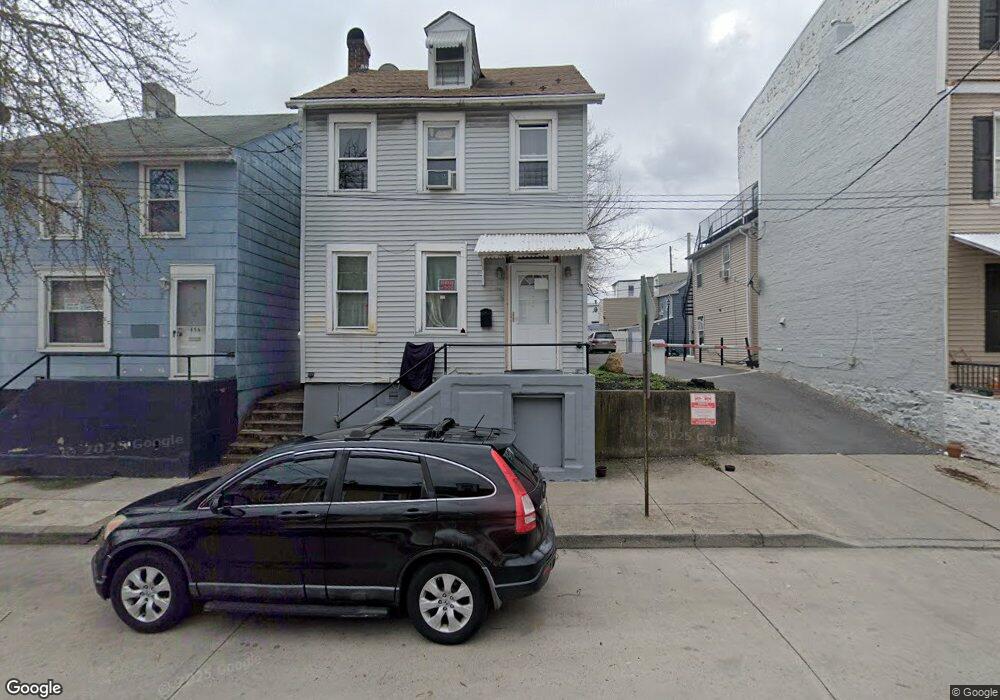
436 N 5th St Allentown, PA 18102
Center City NeighborhoodEstimated Value: $200,000 - $225,000
4
Beds
1
Bath
1,672
Sq Ft
$128/Sq Ft
Est. Value
About This Home
This home is located at 436 N 5th St, Allentown, PA 18102 and is currently estimated at $214,642, approximately $128 per square foot. 436 N 5th St is a home located in Lehigh County with nearby schools including Huntington Elementary School, Central Elementary School, and San Rafael Junior High School.
Ownership History
Date
Name
Owned For
Owner Type
Purchase Details
Closed on
Jan 19, 2005
Sold by
King James A and King Regina M
Bought by
Santiago Juan R
Current Estimated Value
Home Financials for this Owner
Home Financials are based on the most recent Mortgage that was taken out on this home.
Original Mortgage
$66,000
Outstanding Balance
$40,865
Interest Rate
9.37%
Mortgage Type
Purchase Money Mortgage
Estimated Equity
$173,777
Purchase Details
Closed on
Jan 15, 1987
Sold by
Boero Richard W and Boero Marjorie C
Bought by
King James A and King Regina M
Purchase Details
Closed on
Jul 3, 1985
Sold by
Boero Richard W and Jean Marie
Bought by
Boero Richard W and Boero Marjorie C
Create a Home Valuation Report for This Property
The Home Valuation Report is an in-depth analysis detailing your home's value as well as a comparison with similar homes in the area
Home Values in the Area
Average Home Value in this Area
Purchase History
| Date | Buyer | Sale Price | Title Company |
|---|---|---|---|
| Santiago Juan R | $88,000 | -- | |
| King James A | $38,900 | -- | |
| Boero Richard W | $13,000 | -- |
Source: Public Records
Mortgage History
| Date | Status | Borrower | Loan Amount |
|---|---|---|---|
| Open | Santiago Juan R | $66,000 |
Source: Public Records
Tax History Compared to Growth
Tax History
| Year | Tax Paid | Tax Assessment Tax Assessment Total Assessment is a certain percentage of the fair market value that is determined by local assessors to be the total taxable value of land and additions on the property. | Land | Improvement |
|---|---|---|---|---|
| 2025 | $2,596 | $79,700 | $7,100 | $72,600 |
| 2024 | $2,596 | $79,700 | $7,100 | $72,600 |
| 2023 | $2,596 | $79,700 | $7,100 | $72,600 |
| 2022 | $2,506 | $79,700 | $72,600 | $7,100 |
| 2021 | $2,456 | $79,700 | $7,100 | $72,600 |
| 2020 | $2,392 | $79,700 | $7,100 | $72,600 |
| 2019 | $2,353 | $79,700 | $7,100 | $72,600 |
| 2018 | $2,195 | $79,700 | $7,100 | $72,600 |
| 2017 | $2,140 | $79,700 | $7,100 | $72,600 |
| 2016 | -- | $79,700 | $7,100 | $72,600 |
| 2015 | -- | $79,700 | $7,100 | $72,600 |
| 2014 | -- | $79,700 | $7,100 | $72,600 |
Source: Public Records
Map
Nearby Homes