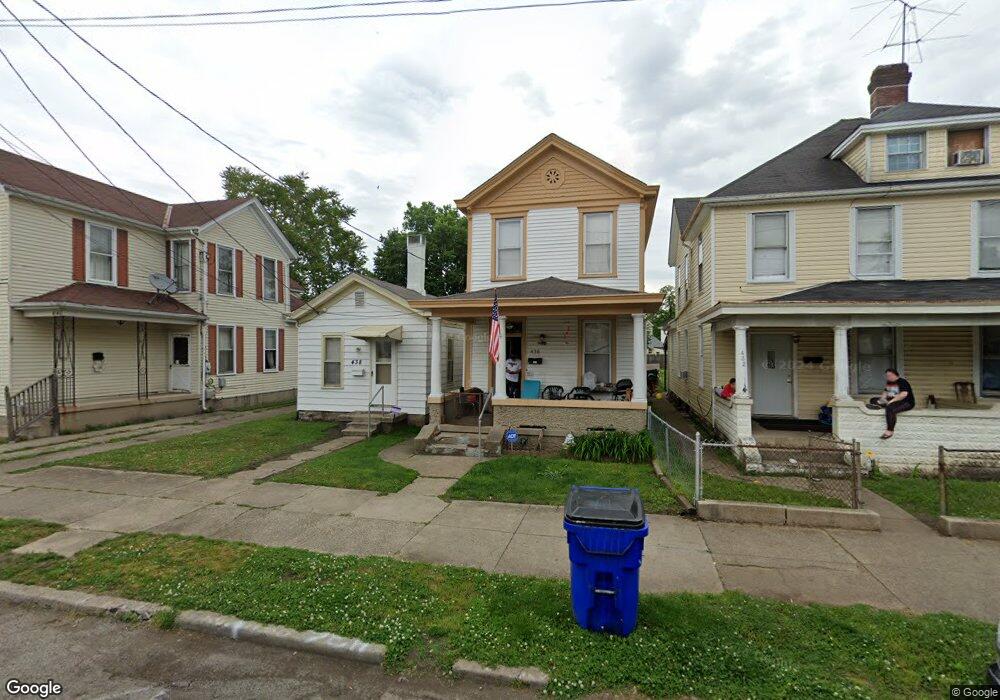
436 N 7th St Hamilton, OH 45011
East Hamilton NeighborhoodEstimated Value: $79,801 - $207,000
4
Beds
2
Baths
1,788
Sq Ft
$64/Sq Ft
Est. Value
About This Home
This home is located at 436 N 7th St, Hamilton, OH 45011 and is currently estimated at $114,200, approximately $63 per square foot. 436 N 7th St is a home located in Butler County with nearby schools including Fairwood Elementary School, Garfield Middle School, and Hamilton Freshman School.
Ownership History
Date
Name
Owned For
Owner Type
Purchase Details
Closed on
Mar 23, 2005
Sold by
Cornett Leo W and Cornett Dianne L
Bought by
Cornellis Properties Llc
Current Estimated Value
Purchase Details
Closed on
May 1, 1996
Sold by
Langdon Chan
Bought by
Cornett Leo W and Ellison John
Home Financials for this Owner
Home Financials are based on the most recent Mortgage that was taken out on this home.
Original Mortgage
$20,960
Interest Rate
7.86%
Mortgage Type
New Conventional
Purchase Details
Closed on
Sep 1, 1985
Create a Home Valuation Report for This Property
The Home Valuation Report is an in-depth analysis detailing your home's value as well as a comparison with similar homes in the area
Home Values in the Area
Average Home Value in this Area
Purchase History
| Date | Buyer | Sale Price | Title Company |
|---|---|---|---|
| Cornellis Properties Llc | -- | -- | |
| Cornett Leo W | $26,200 | -- | |
| -- | $32,900 | -- |
Source: Public Records
Mortgage History
| Date | Status | Borrower | Loan Amount |
|---|---|---|---|
| Previous Owner | Cornett Leo W | $20,960 |
Source: Public Records
Tax History
| Year | Tax Paid | Tax Assessment Tax Assessment Total Assessment is a certain percentage of the fair market value that is determined by local assessors to be the total taxable value of land and additions on the property. | Land | Improvement |
|---|---|---|---|---|
| 2025 | $828 | $15,630 | $1,070 | $14,560 |
| 2024 | $828 | $15,630 | $1,070 | $14,560 |
| 2023 | $775 | $15,630 | $1,070 | $14,560 |
| 2022 | $661 | $11,560 | $1,070 | $10,490 |
| 2021 | $618 | $11,120 | $1,070 | $10,050 |
| 2020 | $640 | $11,120 | $1,070 | $10,050 |
| 2019 | $577 | $7,880 | $1,080 | $6,800 |
| 2018 | $478 | $7,880 | $1,080 | $6,800 |
| 2017 | $380 | $7,880 | $1,080 | $6,800 |
| 2016 | $485 | $7,580 | $1,080 | $6,500 |
| 2015 | $381 | $7,580 | $1,080 | $6,500 |
| 2014 | $866 | $7,580 | $1,080 | $6,500 |
| 2013 | $866 | $16,190 | $2,800 | $13,390 |
Source: Public Records
Map
Nearby Homes