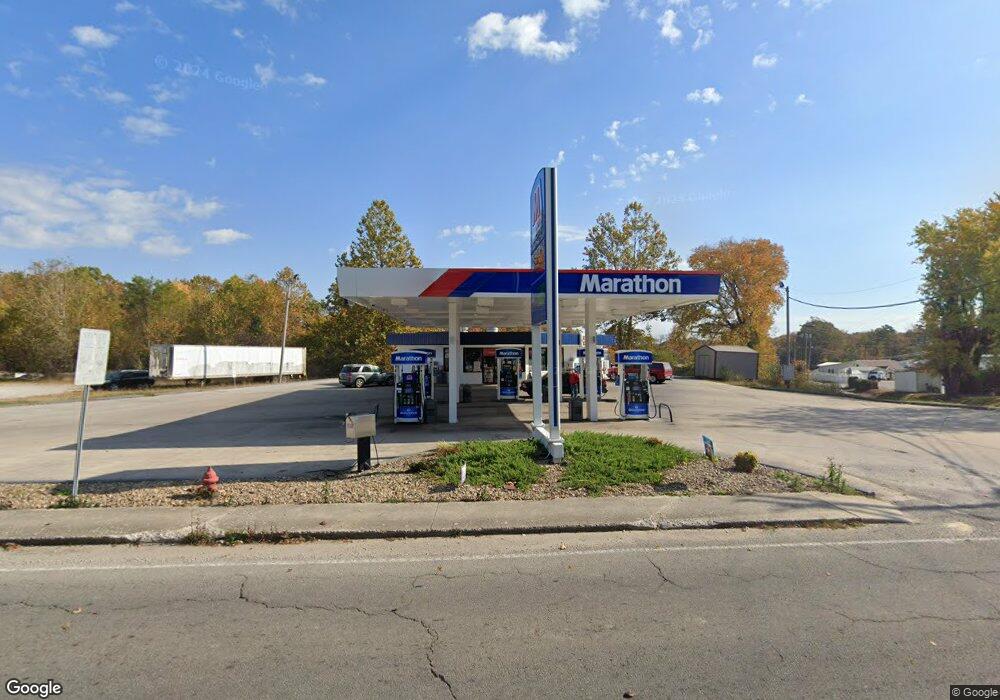
436 N Main St Jamestown, TN 38556
Estimated Value: $605,600
--
Bed
1
Bath
1,053
Sq Ft
$575/Sq Ft
Est. Value
About This Home
This home is located at 436 N Main St, Jamestown, TN 38556 and is currently estimated at $605,600, approximately $575 per square foot. 436 N Main St is a home located in Fentress County with nearby schools including Cumberland Christian School.
Ownership History
Date
Name
Owned For
Owner Type
Purchase Details
Closed on
Mar 31, 2022
Sold by
Tim Smith
Bought by
Avs Enterprise Inc
Current Estimated Value
Home Financials for this Owner
Home Financials are based on the most recent Mortgage that was taken out on this home.
Original Mortgage
$449,600
Interest Rate
3.83%
Mortgage Type
New Conventional
Purchase Details
Closed on
Jan 12, 2012
Sold by
Hyder Freddy
Bought by
Smith Tim
Purchase Details
Closed on
Jun 4, 2007
Purchase Details
Closed on
Oct 13, 1988
Bought by
King Darrell Dwayne
Create a Home Valuation Report for This Property
The Home Valuation Report is an in-depth analysis detailing your home's value as well as a comparison with similar homes in the area
Home Values in the Area
Average Home Value in this Area
Purchase History
| Date | Buyer | Sale Price | Title Company |
|---|---|---|---|
| Avs Enterprise Inc | $850,000 | Howard Amanda M | |
| Smith Tim | $215,000 | -- | |
| -- | $520,000 | -- | |
| King Darrell Dwayne | $45,000 | -- |
Source: Public Records
Mortgage History
| Date | Status | Borrower | Loan Amount |
|---|---|---|---|
| Closed | Avs Enterprise Inc | $449,600 |
Source: Public Records
Tax History Compared to Growth
Tax History
| Year | Tax Paid | Tax Assessment Tax Assessment Total Assessment is a certain percentage of the fair market value that is determined by local assessors to be the total taxable value of land and additions on the property. | Land | Improvement |
|---|---|---|---|---|
| 2025 | -- | $150,880 | $0 | $0 |
| 2024 | -- | $150,880 | $32,000 | $118,880 |
| 2023 | $2,865 | $150,880 | $32,000 | $118,880 |
| 2022 | $3,025 | $115,000 | $46,880 | $68,120 |
| 2021 | $3,025 | $115,000 | $46,880 | $68,120 |
| 2020 | $2,197 | $115,000 | $46,880 | $68,120 |
| 2019 | $3,025 | $115,000 | $46,880 | $68,120 |
| 2018 | $3,025 | $115,000 | $46,880 | $68,120 |
| 2017 | $2,388 | $88,320 | $46,880 | $41,440 |
| 2016 | $2,388 | $88,320 | $46,880 | $41,440 |
| 2015 | $2,388 | $88,314 | $0 | $0 |
| 2014 | $2,388 | $88,314 | $0 | $0 |
Source: Public Records
Map
Nearby Homes