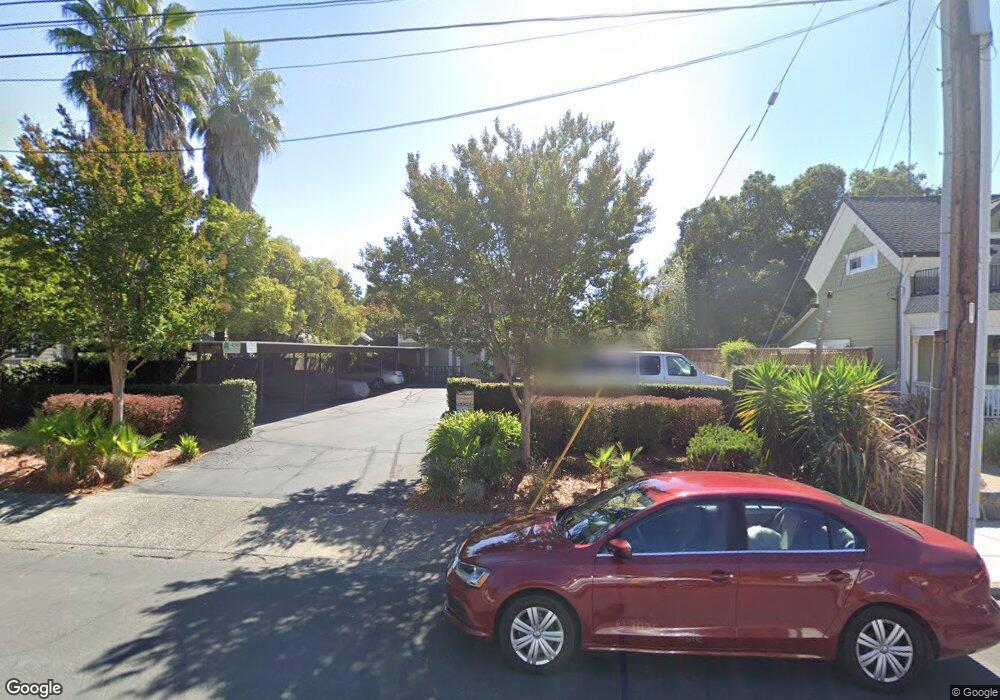
436 North St Unit 7 Healdsburg, CA 95448
Estimated Value: $391,000 - $513,000
2
Beds
1
Bath
675
Sq Ft
$670/Sq Ft
Est. Value
About This Home
This home is located at 436 North St Unit 7, Healdsburg, CA 95448 and is currently estimated at $452,452, approximately $670 per square foot. 436 North St Unit 7 is a home located in Sonoma County with nearby schools including Healdsburg Elementary School, Healdsburg Junior High School, and Healdsburg High School.
Ownership History
Date
Name
Owned For
Owner Type
Purchase Details
Closed on
Oct 26, 2023
Sold by
Park Family 2013 Trust
Bought by
Park Teresa M
Current Estimated Value
Purchase Details
Closed on
Oct 24, 2013
Sold by
Park Dennis M and Park Teresa M
Bought by
Park Dennis M and Park Teresa M
Purchase Details
Closed on
Oct 31, 2012
Sold by
Lecave John P
Bought by
Park Dennis M and Park Teresa M
Home Financials for this Owner
Home Financials are based on the most recent Mortgage that was taken out on this home.
Original Mortgage
$120,000
Interest Rate
3.5%
Mortgage Type
Purchase Money Mortgage
Purchase Details
Closed on
Oct 24, 2012
Sold by
Acevedo Salvador and Acevedo Veronica
Bought by
Lecave John P
Home Financials for this Owner
Home Financials are based on the most recent Mortgage that was taken out on this home.
Original Mortgage
$120,000
Interest Rate
3.5%
Mortgage Type
Purchase Money Mortgage
Purchase Details
Closed on
Nov 29, 2005
Sold by
Acevedo Salvador and Acevedo Veronica
Bought by
Acevedo Salvador and Acevedo Veronica
Home Financials for this Owner
Home Financials are based on the most recent Mortgage that was taken out on this home.
Original Mortgage
$204,000
Interest Rate
5.33%
Mortgage Type
Purchase Money Mortgage
Purchase Details
Closed on
Apr 8, 2002
Sold by
Jordan Jason Alan and Jordan Cheryl Renee
Bought by
Ferguson Phyllis R
Home Financials for this Owner
Home Financials are based on the most recent Mortgage that was taken out on this home.
Original Mortgage
$70,000
Interest Rate
6%
Purchase Details
Closed on
Nov 10, 2001
Sold by
Jordan Jason Alan and Lopez Cheryl Renee
Bought by
Jordan Jason Alan and Jordan Cheryl Renee
Home Financials for this Owner
Home Financials are based on the most recent Mortgage that was taken out on this home.
Original Mortgage
$37,500
Interest Rate
6.67%
Mortgage Type
Stand Alone Second
Purchase Details
Closed on
Dec 15, 2000
Sold by
Turner C Edward and Turner Louise Agnes
Bought by
Jordan Jason Alan and Lopez Cheryl Renee
Home Financials for this Owner
Home Financials are based on the most recent Mortgage that was taken out on this home.
Original Mortgage
$126,100
Interest Rate
7.67%
Purchase Details
Closed on
Feb 16, 2000
Sold by
Turner C Edward and Turner Louise A
Bought by
Turner C Edward and Turner Louise Agnes
Create a Home Valuation Report for This Property
The Home Valuation Report is an in-depth analysis detailing your home's value as well as a comparison with similar homes in the area
Home Values in the Area
Average Home Value in this Area
Purchase History
| Date | Buyer | Sale Price | Title Company |
|---|---|---|---|
| Park Teresa M | -- | None Listed On Document | |
| Park Dennis M | -- | None Available | |
| Park Dennis M | -- | None Available | |
| Lecave John P | $120,000 | First American Title Company | |
| Lecave John P | -- | First American Title Company | |
| Acevedo Salvador | -- | None Available | |
| Acevedo Salvador | $255,000 | Chicago Title Co | |
| Ferguson Phyllis R | $170,000 | Fidelity National Title Co | |
| Jordan Jason Alan | -- | -- | |
| Jordan Jason Alan | $130,000 | Fidelity National Title Co | |
| Turner C Edward | -- | -- |
Source: Public Records
Mortgage History
| Date | Status | Borrower | Loan Amount |
|---|---|---|---|
| Previous Owner | Lecave John P | $120,000 | |
| Previous Owner | Acevedo Salvador | $204,000 | |
| Previous Owner | Ferguson Phyllis R | $70,000 | |
| Previous Owner | Jordan Jason Alan | $37,500 | |
| Previous Owner | Jordan Jason Alan | $126,100 |
Source: Public Records
Tax History
| Year | Tax Paid | Tax Assessment Tax Assessment Total Assessment is a certain percentage of the fair market value that is determined by local assessors to be the total taxable value of land and additions on the property. | Land | Improvement |
|---|---|---|---|---|
| 2025 | $1,838 | $147,760 | $58,487 | $89,273 |
| 2024 | $1,838 | $144,864 | $57,341 | $87,523 |
| 2023 | $1,838 | $142,024 | $56,217 | $85,807 |
| 2022 | $1,791 | $139,240 | $55,115 | $84,125 |
| 2021 | $1,776 | $136,511 | $54,035 | $82,476 |
| 2020 | $3,438 | $135,112 | $53,481 | $81,631 |
| 2019 | $1,725 | $132,464 | $52,433 | $80,031 |
| 2018 | $1,694 | $129,867 | $51,405 | $78,462 |
| 2017 | $1,656 | $127,322 | $50,398 | $76,924 |
| 2016 | $1,565 | $124,826 | $49,410 | $75,416 |
| 2015 | $1,538 | $122,952 | $48,668 | $74,284 |
| 2014 | $1,534 | $120,544 | $47,715 | $72,829 |
Source: Public Records
Map
Nearby Homes
- 426 North St Unit 14
- 423 Matheson St
- 435 University St
- 431 University St
- 421 Tee Dr
- 620 Brown St
- 424 Mason St
- 433 Tee Ct
- 541 Mason St Unit 8
- 635 Brown St
- 446 Tee Ct
- 401 Fairway Ct
- 330 Center St
- 716 University St
- 523 Center St
- 171 Sawmill Cir Unit 102
- 151 Sawmill Cir Unit 402
- 151 Sawmill Cir Unit 201
- 131 Sawmill Cir Unit 203
- 775 Florence Ln
- 436 North St Unit 2
- 436 North St Unit 1
- 436 North St Unit 4
- 436 North St Unit 3
- 436 North St Unit 6
- 436 North St Unit 5
- 436 North St Unit 8
- 436 North St Unit 10
- 436 North St Unit 9
- 444 North St
- 325 University St
- 432 North St Unit 1
- 432 North St Unit A
- 432 North St
- 321 University St
- 426 North St Unit 7
- 426 North St Unit 6
- 426 North St Unit 5
- 426 North St Unit 4
- 426 North St Unit 3
Your Personal Tour Guide
Ask me questions while you tour the home.