Estimated Value: $159,000 - $222,000
3
Beds
1
Bath
1,471
Sq Ft
$131/Sq Ft
Est. Value
About This Home
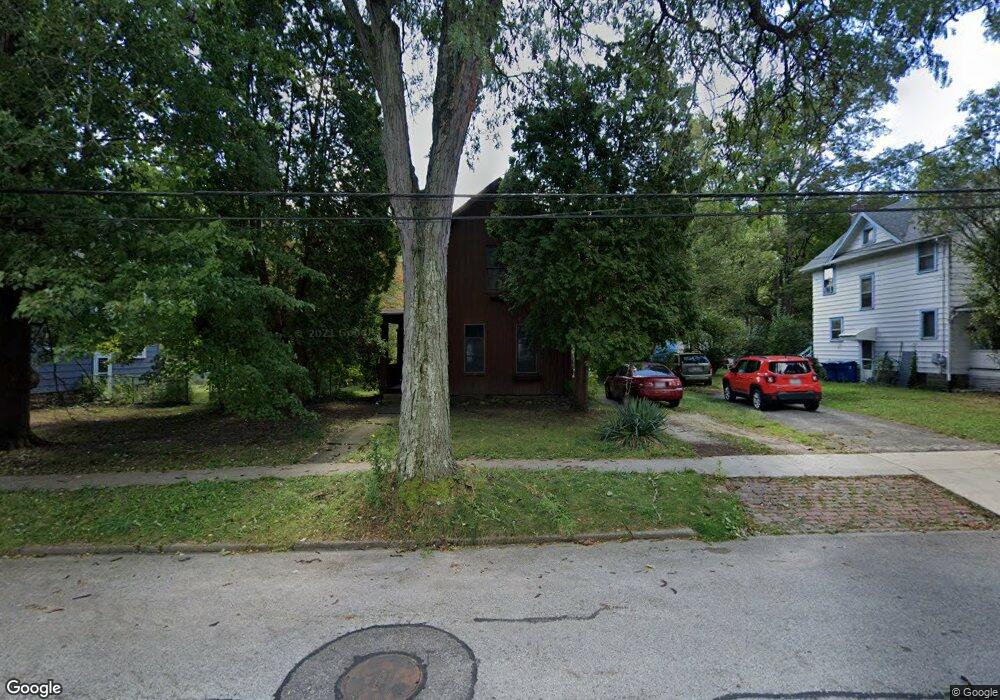
This home is located at 436 Stinaff St, Kent, OH 44240 and is currently estimated at $192,985, approximately $131 per square foot. 436 Stinaff St is a home located in Portage County with nearby schools including Davey Elementary School, Stanton Middle School, and Theodore Roosevelt High School.
Ownership History
Date
Name
Owned For
Owner Type
Purchase Details
Closed on
Apr 11, 2008
Sold by
Lee Callie J and Channell Callie J
Bought by
Channell Eric M and Channell Callie J
Current Estimated Value
Home Financials for this Owner
Home Financials are based on the most recent Mortgage that was taken out on this home.
Original Mortgage
$130,653
Outstanding Balance
$83,280
Interest Rate
6.09%
Mortgage Type
New Conventional
Estimated Equity
$109,705
Purchase Details
Closed on
Nov 10, 2005
Sold by
Fisher Donald Roger and Fisher Lori Anne
Bought by
Lee Callie J
Home Financials for this Owner
Home Financials are based on the most recent Mortgage that was taken out on this home.
Original Mortgage
$101,600
Interest Rate
6.05%
Mortgage Type
Fannie Mae Freddie Mac
Purchase Details
Closed on
Nov 16, 1988
Bought by
Fisher Donald Roger and Fisher Ori
Create a Home Valuation Report for This Property
The Home Valuation Report is an in-depth analysis detailing your home's value as well as a comparison with similar homes in the area
Home Values in the Area
Average Home Value in this Area
Purchase History
| Date | Buyer | Sale Price | Title Company |
|---|---|---|---|
| Channell Eric M | -- | New Market Title Llc | |
| Lee Callie J | $127,000 | Village Title Agency | |
| Fisher Donald Roger | $39,000 | -- |
Source: Public Records
Mortgage History
| Date | Status | Borrower | Loan Amount |
|---|---|---|---|
| Open | Channell Eric M | $130,653 | |
| Closed | Lee Callie J | $101,600 |
Source: Public Records
Tax History Compared to Growth
Tax History
| Year | Tax Paid | Tax Assessment Tax Assessment Total Assessment is a certain percentage of the fair market value that is determined by local assessors to be the total taxable value of land and additions on the property. | Land | Improvement |
|---|---|---|---|---|
| 2024 | $2,660 | $57,830 | $9,560 | $48,270 |
| 2023 | $2,455 | $43,300 | $9,560 | $33,740 |
| 2022 | $2,453 | $43,300 | $9,560 | $33,740 |
| 2021 | $2,493 | $43,300 | $9,560 | $33,740 |
| 2020 | $2,300 | $36,130 | $9,560 | $26,570 |
| 2019 | $2,300 | $36,130 | $9,560 | $26,570 |
| 2018 | $2,321 | $32,830 | $10,010 | $22,820 |
| 2017 | $2,321 | $32,830 | $10,010 | $22,820 |
| 2016 | $2,254 | $32,830 | $10,010 | $22,820 |
| 2015 | $2,255 | $32,830 | $10,010 | $22,820 |
| 2014 | $2,293 | $32,830 | $10,010 | $22,820 |
| 2013 | $2,277 | $32,830 | $10,010 | $22,820 |
Source: Public Records
Map
Nearby Homes
- 440 Stinaff St
- 430 Stinaff St
- 437 Burns Ct
- 448 Stinaff St
- 424 Stinaff St
- 454 Stinaff St
- 437 Stinaff St
- 429 Stinaff St
- 429 Stinaff St Unit 1
- 441 Stinaff St
- 431 Stinaff St
- 425 Stinaff St
- 447 Stinaff St
- 460 Stinaff St
- 436 Burns Ct
- 417 Stinaff St
- 453 Stinaff St
- 830 N Mantua St
- 824 N Mantua St
- 824 N Mantua St