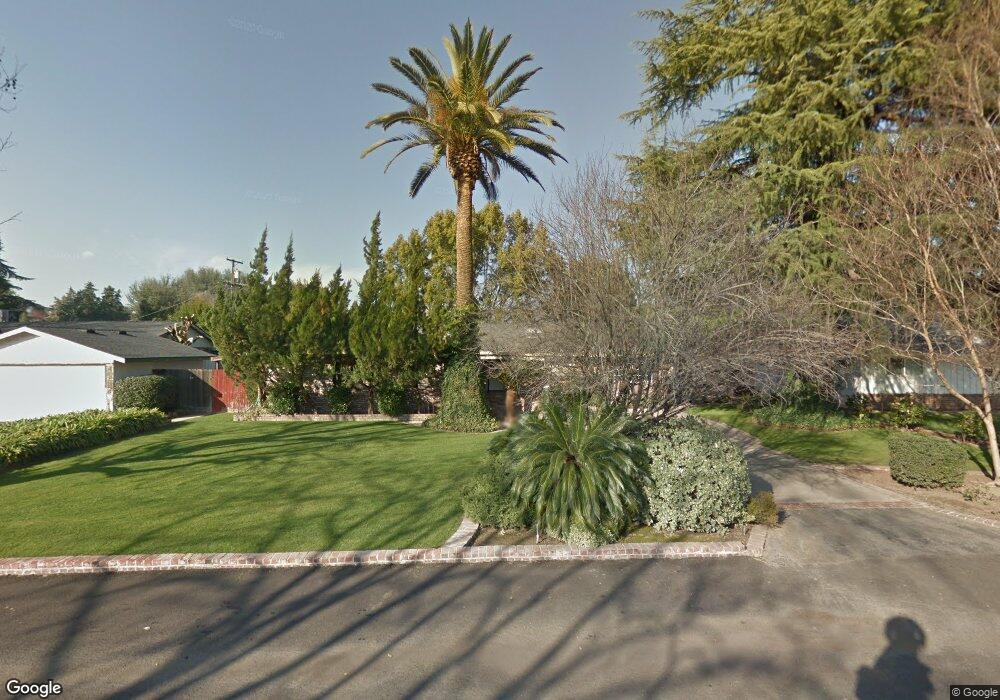
436 W Twain Ave Fresno, CA 93704
Bullard NeighborhoodEstimated Value: $439,486 - $490,000
3
Beds
2
Baths
2,050
Sq Ft
$225/Sq Ft
Est. Value
About This Home
This home is located at 436 W Twain Ave, Fresno, CA 93704 and is currently estimated at $460,372, approximately $224 per square foot. 436 W Twain Ave is a home located in Fresno County with nearby schools including Kratt Elementary School, Tenaya Middle School, and Bullard High School.
Ownership History
Date
Name
Owned For
Owner Type
Purchase Details
Closed on
Sep 11, 2017
Sold by
Shaw Dayton and Shaw Somer Marie Elizabeth
Bought by
Shaw Dayton C and Shaw Somer M
Current Estimated Value
Home Financials for this Owner
Home Financials are based on the most recent Mortgage that was taken out on this home.
Original Mortgage
$150,000
Interest Rate
3.93%
Mortgage Type
New Conventional
Purchase Details
Closed on
Aug 19, 2014
Sold by
Shaw Jon D and Shaw James B
Bought by
Shaw Dayton and Shaw Somer Marie Elizabeth
Purchase Details
Closed on
Dec 23, 2011
Sold by
Shaw Janet R
Bought by
Shaw Janet R and Shaw James B
Purchase Details
Closed on
Feb 5, 2003
Sold by
Bailey Michael A
Bought by
Bailey Tiffiny A
Create a Home Valuation Report for This Property
The Home Valuation Report is an in-depth analysis detailing your home's value as well as a comparison with similar homes in the area
Home Values in the Area
Average Home Value in this Area
Purchase History
| Date | Buyer | Sale Price | Title Company |
|---|---|---|---|
| Shaw Dayton C | -- | Placer Title Fresno | |
| Shaw Dayton | $150,000 | None Available | |
| Shaw Janet R | -- | None Available | |
| Bailey Tiffiny A | -- | Stewart Title Of Fresno Cnty | |
| Henderson Sara | -- | Stewart Title Of Fresno Cnty |
Source: Public Records
Mortgage History
| Date | Status | Borrower | Loan Amount |
|---|---|---|---|
| Closed | Shaw Dayton C | $150,000 | |
| Closed | Shaw Dayton | $0 |
Source: Public Records
Tax History Compared to Growth
Tax History
| Year | Tax Paid | Tax Assessment Tax Assessment Total Assessment is a certain percentage of the fair market value that is determined by local assessors to be the total taxable value of land and additions on the property. | Land | Improvement |
|---|---|---|---|---|
| 2025 | $3,050 | $257,005 | $86,480 | $170,525 |
| 2023 | $2,990 | $247,027 | $83,123 | $163,904 |
| 2022 | $2,948 | $242,185 | $81,494 | $160,691 |
| 2021 | $2,865 | $237,438 | $79,897 | $157,541 |
| 2020 | $2,852 | $235,004 | $79,078 | $155,926 |
| 2019 | $2,739 | $230,397 | $77,528 | $152,869 |
| 2018 | $2,678 | $225,880 | $76,008 | $149,872 |
| 2017 | $2,633 | $221,607 | $82,844 | $138,763 |
| 2016 | $2,545 | $217,459 | $56,953 | $160,506 |
| 2015 | $2,505 | $214,194 | $56,098 | $158,096 |
| 2014 | $1,016 | $89,943 | $15,241 | $74,702 |
Source: Public Records
Map
Nearby Homes
- 5082 N Maroa Ave
- 5075 N College Ave
- 5076 N Wishon Ave Unit A
- 5048 N Wishon Ave Unit E
- 5090 N Roosevelt Ave Unit 11
- 548 W San Jose Ave
- 5180 N Wishon Ave Unit 201
- 5180 N Wishon Ave Unit 103
- 705 E Alamos Ave
- 4915 N Wishon Ct
- 4834 N Wishon Ave
- 5370 N Maroa Ave
- 520 W Barstow Ave
- 1541 E Fairmont Ave Unit 103
- 4689 N Van Ness Blvd
- 4843 N Palm Ave
- 1216 E Pico Ave
- 4822 N Safford Ave
- 116 E Alamos Ave
- 1438 E Rialto Ave
- 424 W Twain Ave
- 454 W Twain Ave
- 439 W Keats Ave
- 453 W Keats Ave
- 425 W Keats Ave
- 412 W Twain Ave
- 468 W Twain Ave
- 439 W Twain Ave
- 425 W Twain Ave
- 467 W Keats Ave
- 453 W Twain Ave
- 415 W Twain Ave
- 480 W Twain Ave
- 467 W Twain Ave
- 428 W Shaw Ave
- 479 W Keats Ave
- 438 W Keats Ave
- 442 W Shaw Ave
- 454 W Keats Ave
- 424 W Keats Ave